Hi, what do you want to do?
Curated OER
Data Collection
Students write a journal exercise that relates to pets. They collect information from each other in order to practice making and interpreting bar graphs. They Continue building different kinds of graphs with the group.
Curated OER
Usage and Interpretation of Graphs
Cooperative groups are formed for this graphing activity. Each group must construct a graph that represents how many eyelets (the holes for laces in shoes), are present in their group. A whole-class bar graph is eventually constructed...
Curated OER
Call it "Macaroni"
Who knew there were so many fun educational opportunities featuring pasta? Scholars read a brief informational text about the history of pasta (note that "macaroni" is spelled two different ways, so address this if kids are reading...
Curated OER
Graphing
Students collect data to create different types of graphs-line, pie, and bar graphs. They use StarOffice 6.0 to create graphs.
Curated OER
Usage and Interpretation of Graphs
Students explore graphing. In this graphing lesson, students predict how many shoe eyelets are present in the classroom. Students count eyelets and work in groups to organize and chart the data collected. Students put all the data...
Curated OER
Graphing Using Cookies
Students differentiate between bar graphs, line graphs, pictographs and bar graphs. After participating in a hands-on cookie activity, students label and draw their own graphs.
Curated OER
Counting Candies
Students count, sort, and classify jellybeans by color. They use their data to create a bar graph. Students are given a small bag of jellybeans, and a worksheet on Counting Candies Tally Chart. They work in small groups. Students are...
Curated OER
Dealing With Data
Students collect, organize, and display data using a bar graph, line graph, pie graph, or picture graph. They write a summary describing the data represented and compare the graph to another graph in the class.
Haiku Deck
Haiku Deck - Beautiful Presentations and Slideshows with Charts and Graphs
Create beautiful and simple presentations, sales pitches, lessons, and visual stories that utilize Getty Images, high quality photos licensed under Creative Commons, as well as your own prints. What you create will demand people’s...
Curated OER
Usage and Interpretation of Graphs
Students review graphing and use processing skills to solve problems.
Curated OER
Using Spreadsheets and Graphs
Third graders explore mathematics by utilizing computers. In this graphing instructional activity, 3rd graders gather class data based on a particular topic such as the "favorite candy" of the class. Students utilize this information and...
Math Moves U
Collecting and Working with Data
Add to your collection of math resources with this extensive series of data analysis worksheets. Whether your teaching how to use frequency tables and tally charts to collect and organize data, or introducing young...
Curated OER
Activity: An Experiment with Dice
Roll the dice with this activity and teach young mathematicians about probability. Record outcomes for rolling two number cubes in order to determine what is most likely to happen. Graph the data and investigate patterns in the results,...
Curated OER
Data Display
Students explore different ways to display data. In this statistics lesson plan, students create pie charts, bar graphs and line graphs to show data. Students then write a paragraph discussing which types of graphs are helpful for...
K12 Reader
Displaying Data
It's important to learn how to display data to make the information easier for people to understand. A reading activity prompts kids to use context clues to answer five comprehension questions after reading several paragraphs about...
Curated OER
Mmm, Mmm, M&M's
Here is another version of the classic M&M math lesson. In this one, upper graders utilize the ClarisWorks Spreadsheet program in order to document the data they come up with from their bags of M&M's. After making their initial...
Curated OER
Bird Feeding and Migration Observation
Students research bird migration and build a bird house. In this bird lesson plan, students research the birds in their area and where they migrate to. They also build their own bird house and record data on what kinds of birds come to...
Curated OER
An Apple A Day
Students create a graph that showcases their pick for favorite kind of apple. Students are given samples of a variety of apples to determine their favorite in a taste test. They a create a tally chart of favorite kinds apples and use a...
Curated OER
Pond Theme Unit
In this pond theme worksheet students research facts on pond life. Students complete comprehension questions, crosswords, word search, and math puzzles. Students write a short report.
Curated OER
Leaping Lemurs! How far can you jump?
Students watch a segment of the PBS video which show the lemurs' ability to jump. In pairs, students collect measurement data involving each other's length of a standard step, a standing broad jump, and a long jump. They record their...
Curated OER
Thank You... Thomas Edison!
Learners investigate the life of Thomas Edison. They research how he made a difference. They understand that accurate data collection is important for math. They create a chart using spreadsheet data.
US Department of Education
National Center for Education Statistics: Create a Graph Tutorial
This tutorial walks students through how to create different types of graphs using the Create a Graph tool available on the website. Covers bar graphs, line graphs, pie charts, area graphs, scatter plots, and dependent and independent...
US Department of Education
Nces: Create a Graph: Kids Zone
Make your own pie, bar, line, area or XY graph with this interactive tool. Look for examples of graphs already created from data collected by the National Center for Education Statistics. Complete with a graphing tutorial.
National Center for Ecological Analysis and Synthesis, University of California Santa Barbara
Nceas: Graph Types
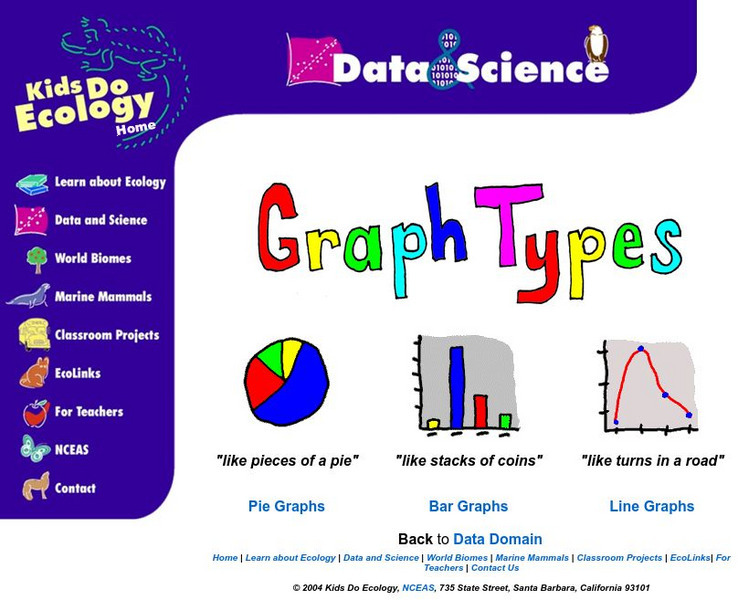
At this site from NCEAS you can learn how to organize your data into pie graphs, bar graphs, and line graphs. Explanations and examples are given of each graph along with several questions that check comprehension.


