Curated OER
Focusing on Lenses
Students explore scientific observations by examining the parts of a microscope. In this optics lesson, students discuss the importance of a focal point and focal distance when utilizing an optical device such as a microscope. Students...
Curated OER
Watershed Model
Students view a presentation of water and land and how we need to protect our water resources. In this water lesson plan, students discuss how we rely on water, and complete activities in all subjects related to water.
Agriculture in the Classroom
Roll of the Genes
Animal reproduction in sheep and cattle is explored with the help of Punnet squares. Scholars employ tools using probability to conclude the color of wool a sheep's offspring will have. Acting as animal geneticists, pupils then take...
Curated OER
A Picture is Worth a Thousand Words
Pupils create various types of graphs. They go to suggested websites to collect data and create graphs to organize the data. Then they answer questions according to their graph.
Curated OER
Econ in a Bag
Here is a nice idea, have your young entrepeneurs form their own companies. Each company is given a paper bad to locate and place resources in that they can use to create products their businesses sell on Sale Day. They identify and...
Alberta Learning
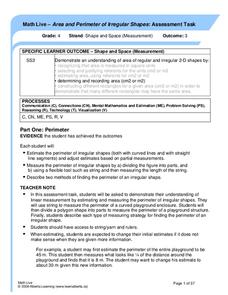
Area and Perimeter of Irregular Shapes
Evaluate young mathematicians' understanding of area and perimeter with this series of three assessment tasks. Challenging students to not only calculate the area and perimeter of irregular shapes, but to explain in writing their...
Curated OER
Plumbing the Deep-Using Sound Waves to See
Students explore and learn about the concept of echolocation. In this echolocation lesson, students explore how animals and engineers use echolocation (seeing under water) and sound waves to look and hear things under the deep water.
Curated OER
Checking the Surf
Pupils read and discuss waves and their wavelengths and amplitudes. In this waves lesson plan, students draw the wavelength and amplitude of a wave and discuss tsunamis and storms.
Curated OER
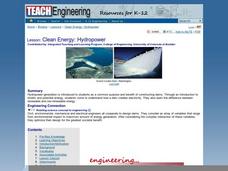
Clean Energy: Hydro-power
Students read about and discuss renewable and non renewable energy and identify how a dam produced energy using hydro-power. In this water energy lesson plan, students look at diagrams and pictures of water energy technology.
Curated OER
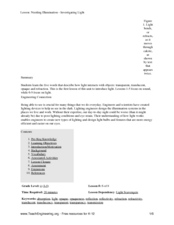
Investigating Light
Students study concepts associated with light. In this light instructional activity, students observe an demonstration by the teacher. They examine reflection and refraction of light and name things that reflect light and those that...
Curated OER
Animals and Engineering
Students study animal classification and their interactions. In this animals and engineering lesson students study animal communities and how engineers use this knowledge to create new technologies.
Curated OER
Chemical Wonders
Students read about and discuss how chemical engineers use different states of matter to create substances. In this chemical engineering lesson plan, students also give examples of the 3 kinds of matter.
Curated OER
MathKeys Software "Unlocking Whole Numbers, Vol 2 (Rolling the Highest Number)"
Third graders arrange four numbers in order to make the highest number possible. In this place value lesson plan, 3rd graders practice working with four digit numbers on the computer and with base ten blocks.
Curated OER
Holiday Cards using Publisher
Learners create a holiday card using technology. In this technology instructional activity, students use Publisher templates to create a holiday card. Learners organize, design, and edit their card.
Curated OER
Hidden Pictures
Third graders practice their multi-digit addition math skills by uncovering a hidden picture as they correctly answer math problems utilizing the A+ Math Web site "Hidden Pictures Game".
Curated OER
Holiday Flier in Publisher
Students use Publisher in this lesson to make a holiday flier. For this technology lesson, students create a holiday flier. Students choose fonts, use clipart, use grammar and spelling check, and save to their work to a flash drive or...
Curated OER
Rounding to the Nearest Ten
Third graders review rounding to the nearest ten. In this rounding lesson, 3rd graders use a hundred chart to help them in rounding to the nearest ten. Additionally, students practice rounding on the computer.
Curated OER
Smoses Toy Expo
Young scholars research one of the simple machines listed in the lesson and review several simple machine websites to complete their research. Students use software and a watch a video to learn more about machines. Young scholars...
Curated OER
Electric Circuits
Students explore energy by completing an electricity worksheet. In this conductors lesson plan, students define the energy related vocabulary terms circuit, electronics, conductor and semi-conductor before examining computer chips in...
Curated OER
Aeronautics: Bernoulli's Principle
Students explore physics by participating in a science activity in class. In this flight properties lesson, students identify Bernoulli's principle of flight and his theory of statics and motion. Students conduct a demonstration by...
Curated OER
Force and Gliders
Students explore physics by creating data graphs in class. In this flight properties instructional activity, students read the book Flying Machine and identify the force, resistance and construction necessary to keep a glider in the air....
Curated OER
Adapting the Game Concentration
I love classroom games, and this plan deftly describes how you can use the game Concentration across the curriculum to reinforce skills. I wish I would have thought of this when I was teaching this age level. These kinds of games are...
Curated OER
Yellow Pages Ad-dition
Learners determine the revenue generated by sample pages from the Yellow Pages. They discuss the value of advertising a business in this venue. They use the local telephone directory and some fictitious ad rates to lead their inquiry.
Curated OER
Create a Graph Online
Scholars create colorful bar, line, or pie graphs. They decide on a survey question to ask or a type of data to gather. From there, they collect information and data. They display this data in bar, line, or pie graphs that they create...


