Math Worksheets 4 Kids
Pictograph Christmas Gifts
Add holiday cheer to math practice with a Christmas themed learning exercise designed to reinforce skip counting by two and solving word problems.
Worksheet Web
Using Pictographs
If one ice cream cone represents three ice cream scoops, and Bob has four ice cream cones, then how many scoops does Bob have? Learners solve these kind of questions with their new understanding of pictographs.
Scholastic
Study Jams! Pictograph
An easy and fun way to look at data is with a pictograph. A lesson plan friendly enough for multiple grade levels shows how to set up this graph with a corresponding key. The steps review the importance of choosing an appropriate...
Curated OER
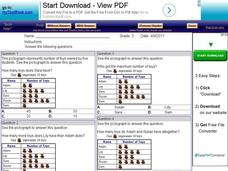
Pictographs
What do these pictographs show? Scholars analyze three sets of data organized into pictographs, filling in several comprehension questions about each. The first one is done for them as an example, but consider going over it together to...
Curated OER
Bar Graphs and Pictographs
How are bar graphs and pictographs different? As you begin this concept, use these simple graphs to help get learners started with data analysis styles. There is one bar graph and one pictograph, each accompanied by four or five...
Houghton Mifflin Harcourt
Unit 3 Math Vocabulary Cards (Grade 3)
Looking for math vocabulary cards for third graders? Use a set of 15 math cards with terms associated with graphing. The top half of each sheet has the vocabulary word printed in bold text, and the bottom half includes...
Math Worksheets Land
Halloween Interpreting Pictograph
The best part about Halloween is the candy. Individuals read a pictograph that depicts the amount of candy five children received. Then, they respond to five questions using the picture graph to support their answers.
Curated OER
Pumpkin Picture Graph
In this pumpkin picture graph worksheet, students read and analyze each picture graph and then answer the eight questions that follow.
Curated OER
Complete the Graphs
First, second, and third graders make pictographs. There are four graphs to complete, and the answer sheet is included. Consider providing your learners with special needs two sets of stickers to use, instead of requiring them to draw...
Curated OER
Read a Picture Graph
It's the Bears vs. the Seals! Who is the season winner? Read this data and have your math class answer the six questions that follow. Consider graphing the chart as a class, or encouraging individuals to graph it before answering the...
Curated OER
Ice Cream Pictograph
Students create a graph. In this pictograph lesson, students cut out 20 small ice cream cones and decorate them. Students create a pictograph with their ice cream cones.
Curated OER
Tally Chart/Pictograph
In this graphic organizer worksheet, students can record their own data on this tally chart/pictograph. There are two columns and six rows with room for a title.
Curated OER
"Eggs-ploring" Math with Jellybeans
Learners work in pairs with a small bag of jellybeans to estimate the number of candies in their bags and then figure out how many groups of 10 jellybeans are contained in their bags. They then graph the information using a pictograph or...
Curated OER
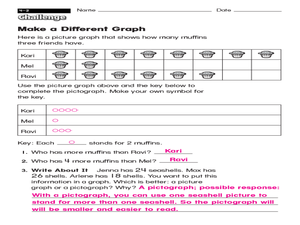
Make a Different Graph
What is the difference between a picture graph and a pictograph? Young learners are given a picture graph detailing how many muffins three friends have, and they must complete a pictograph using a symbol of their choice. An answer key is...
Curated OER
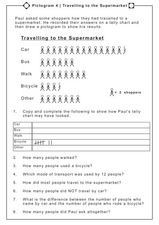
Pictogram 4: Traveling to the Supermarket
In this creating and comprehending a tally chart worksheet, students use a pictograph to tally the number of ways people traveled to the supermarket, tally the results, and answer comprehensive questions. Students answer 8 questions.
Math Moves U
Collecting and Working with Data
Add to your collection of math resources with this extensive series of data analysis worksheets. Whether your teaching how to use frequency tables and tally charts to collect and organize data, or introducing young...
Curated OER
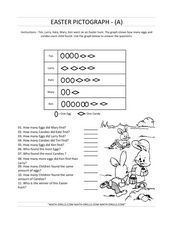
Easter Pictograph
In this pictograph worksheet, students look at the Easter pictograph and solve problems based on the graph. Students complete 10 problems.
Curated OER
Read a Pictograph
In this data display worksheet, students solve 4 problems in which data on a tally chart and pictograph are analyzed. Students use this information to solve the problems.
Curated OER
Survey Says...
Young learners create and implement a school-wide survey about student body favorites! Learners record and analyze the data on a bar graph, picture graph, and line graph, and then display the data. Then, wrap it all up with a celebration...
Curated OER
Sunshine Math- 2 Earth, IV
For this math problem solving worksheet, students complete 6 problems that include: pictographs, reasoning, basic operations, and money.
Curated OER
Using Pictographs With Data
In this using pictographs with data worksheet, 3rd graders read data from a pictograph to answer ten multiple choice questions. Answers can be shown on the screen.
Curated OER
Interpreting a Pictogram
In this pictogram worksheet, students interpret a pictograph on ladybirds and answer 5 short answer questions or drawings referring back to the pictogram. Students carry out their own scenario pictogram and draw a table with their results.
Curated OER
Lucky Charms Pictograph
Third graders create pictographs using a breakfast cereal. This fun, hands-on lesson plan allows students to use Lucky Charms cereal to create a pictograph. When the lesson plan is through, 3rd graders get to eat their Lucky Charms...
Curated OER
Classmate Pictograph
Learners create pictographs using their classmates in this technology-based lesson plan. The lesson plan uses Inspiration, or Kidspiration, digital cameras, and a downloadable pictograph template.


