Curated OER
Picturing Hats
In this pictographs worksheet, students examine a pictograph then solve 11 problems related to the data in the pictograph. Students cross out problems that do not relate to the pictograph.
Curated OER
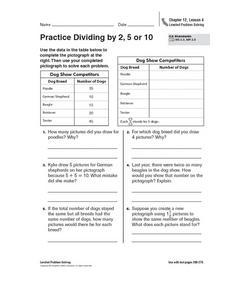
Practice Dividing by 2, 5, or 10
In this pictograph problem solving worksheet, students analyze the data on a table and create a pictograph. Students read and solve 6 story problems about the pictograph.
Curated OER
M&M Graphing and Probability
Students sort, classify, and graph M & M's. They create pictographs and bar graphs with the colors and numbers in each bag of M & M's. They calculate the ratio and probability based on class results.
Curated OER
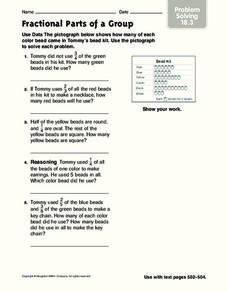
Fractional Parts of a Group
In this problem solving activity, students problems solve the answers to 5 mathematical word problems involving fractional parts. Students use data from a pictograph to assist them in solving each word problem.
Curated OER
Where Did the Bunny Leave the Eggs? Picture Graphing Activity
The Easter Bunny left us a bunch of eggs, but how many did he leave? Learners use the data to create a picture graph, interpret it, and answer the questions that follow. There's even easy egg cut-outs for your youngsters!
Curated OER
Rubber Band Banza
Third graders review ideas about sound and vibration to make their own stringed instrument. They review what a pictograph and bar graph are. Pupils conduct a survey within the classroom to choose the four favorite string instruments and...
Curated OER
Math--Pictures and Bars--Learning About Graphs
What is a graph? What does it tell us? How do you make one? These are all questions that are answered in the included packet. It's a great introduction to graphing for young learners!
Curated OER
Data Handling: Pictogram of Birds
In this pictograph problem solving worksheet, students analyze a pictograph of birds seen each day for a week. They use the information on the graph to solve 6 problems.
Curated OER
Choose a Graph to Display Data
In this math graphs worksheet, students write line plot, tally chart, pictograph, or bar graph to tell the best kind of graph to use to answer the six questions.
Curated OER
Flower Comparison Activity
Elementary schoolers write equations for comparisons and make a pictograph based on their comparison. Answers included on page 2.
Curated OER
Probability Using M&M's
Students estimate and then count the number of each color of M&M's in their bag. In this mathematics lesson, students find the experimental probability of selecting each color from the bag. Students create pictographs and bar graphs...
Curated OER
Easter Egg Pictograph
In this pictograph worksheet, students use a given graph to answer questions about Easter eggs found by children and answer related questions. A website reference for additional resources is given.
Captain Planet Foundation
Shape Shifters in the Math Garden
Combines mathematical measurement with gardening skills. Third graders hunt for worms in the garden and try to find the longest one. They also measure and weigh vegetables that they harvest from the garden, measure rainfall amounts,...
Curated OER
Sunshine Math-1
In this math skills worksheet, students answer 7 questions in which they use various basic math skills. They use number lines, charts, number blocks, a calendar and a ruler to complete this worksheet.
Curated OER
Use a Graph
Information is often presented in graph form. Can your youngsters read a basic bar or picture graph? Six word problems accompany three graphs. One graph is a bar graph and the other two are pictographs.
Curated OER
Special Ed. Resource
Ways to organize data is the focus of this math PowerPoint. Students view slides that define and give descriptions of a variety of graphs, and how mean, median, and mode are found. A good visual tool which should benefit almost all types...
Curated OER
Can You Count on Cans?
How can a canned food drive be connected to math? It's as simple as counting and organizing the cans! Children demonstrate their ability to sort non-perishable foods into categories that include soup cans, vegetable cans, boxed items,...
National Security Agency
Line Plots: Frogs in Flight
Have a hopping good time teaching your class how to collect and graph data with this fun activity-based lesson series. Using the provided data taken from a frog jumping contest, children first work together...
Curated OER
Bird Pictogram Page 2
In this math worksheet, students examine a pictogram which shows the 4 most common foods of wild birds. Students analyze the pictogram and answer 8 questions about the data displayed.
Curated OER
Numeracy Practice Math Sports
In this math worksheet, students match the pictographs to find the quantities and write each number sentence. They use the operation of addition.
Curated OER
Sunshine Math- 2
In this math applications worksheet, students solve 6 varied problems that include estimation, money, basic operations, pictographs and geometry.
Fuel the Brain
Egg Hunt Pictograph
If you did a hypothetical egg hunt in class, wouldn't it be great to see how many eggs were collected? Your youngsters will receive a list of "collected data" and create a pictograph.
Curated OER
Favorite Season
In this graphing worksheet, learners conduct a survey of people's favorite survey. They then complete 8 questions about the data gathered before creating a bar graph and pictograph on templates.
Curated OER
BBC Bird Pictogram- Math Worksheet
In this British math learning exercise, students develop a pictogram based on the information that is given about what certain types of birds like to eat. They see pictures of the birds and their food preferences before completing the...


