Curated OER
From Home To School
Young scholars locate and use internet maps to trace a route from their home to school. They calculate the distance of the route using the map legend then determine the distance they travel to school and back in a regular school week...
Curated OER
Showing Favorites
In this tally chart worksheet, students use the tally chart on the page to answer 2 questions. They then solve the last 2 questions using their own tally chart.
Discovery Education
Mood Music!
Grouchy? Sad? Here's a great resource that shows kids how music can be used to lift their spirits. Kids collect and chart data on the effects of music on emotions. After analyzing the results of their experiment, they develop...
Curated OER
Living in the Desert
Conduct an investigation on the plants used by the Hohokam tribe. To survive in the harsh desert environment the Hohokam used many natural resources. Learners read, research, map, and graph multiple aspects of Hohokam plant use as a...
Alabama Learning Exchange
How Clouds Form
Young scholars analyze how clouds form. In this cloud formation lesson, young scholars brainstorm types of clouds and what they think they're made of. Young scholars conduct an experiment to see how clouds form and discuss their...
Curated OER
Touch and Discover
Students identify the physical properties of items using the sense of touch. In this touch and discover lesson, students describe items. Students sort items using a Venn diagram.
Curated OER
Learning About Our World
Students explore their world using the book "This is the Way We Go to School." They predict information about the story based on the title and pictures. Students label a world map with the names of continents and oceans. They write a set...
Curated OER
How Do I Measure Up?
Students measure and record weights and heights and compare to others in the class as they find out more about their bodies.
Curated OER
Probability With a Random Drawing
Students define probability, and predict, record, and discuss outcomes from a random drawing, then identify most likely and least likely outcomes. They conduct a random drawing, record the data on a data chart, analyze the data, and...
Curated OER
Foods and Languages of the World
Learners review Mexico's location and language and learn to pronouns 10 new Spanish food words. Students listen as the book, Corn is Maize is read, touching and passing around an ear of Indian corn. Learners discuss the contribution of...
Curated OER
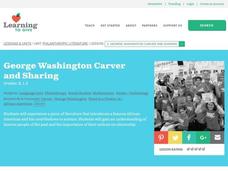
George Washington Carver and Sharing
Students research George Washington Carver. In this science lesson, students discuss George Washington Carver's contribution to science. Students explain how peanut butter is produced.
Curated OER
How Much Do We SPend For Electricity?
Students investigate the concept of energy and focus upon the usage and the cost associated with it. They conduct research using a variety of resources while working in cooperative groups. Students graph the usage of energy as estimates...
Curated OER
Making Sense of the Census
In this unit of lessons, students make sense of the Census. They examine why a census is taken and participate in activities.
Curated OER
What is a Cloud
Third graders study clouds and how they are formed. They write acrostic poems about clouds and analyze and graph temperature data collected during varying degrees of cloud cover.
Math Is Fun
Math Is Fun: Pictographs
Explains, with examples, what pictographs are and their limitations. Includes ideas for making a pictograph and a set of practice questions.
E-learning for Kids
E Learning for Kids: Math: Pizza (Italian) Restaurant: Data and Chance
In this interactive site, students practice with bar and picture graphs by helping a pizza place collect and analyze their data.
Illustrative Mathematics
Illustrative Mathematics: 3.oa, Md, Nbt Classroom Supplies
The purpose of this task is for students to solve problems involving the four operations and draw a scaled picture graph and a scaled bar graph to represent a data set with several categories. Aligns with 3.NBT.A.2;...
BBC
Bbc: Representing Data
This BBC Math Bite tutorial for line graphs, pictograms, and frequency polygons features an exam in which students draw and interpret statistical diagrams.
Louisiana Department of Education
Louisiana Doe: Louisiana Believes: Eureka Math Parent Guide: Collecting and Displaying Data
A guide to support parents as they work with their students in collecting and displaying data.
Other
Ohio Department of Education: Third Grade Achievement Test (Practice Test) [Pdf]
Half-length practice test for the third grade OAT (Ohio Achievement Test). The test includes 15 multiple-choice and 5 open-response question dealing with topics such as measurement (time, angles, ruler), data analysis (bar graphs,...
Khan Academy
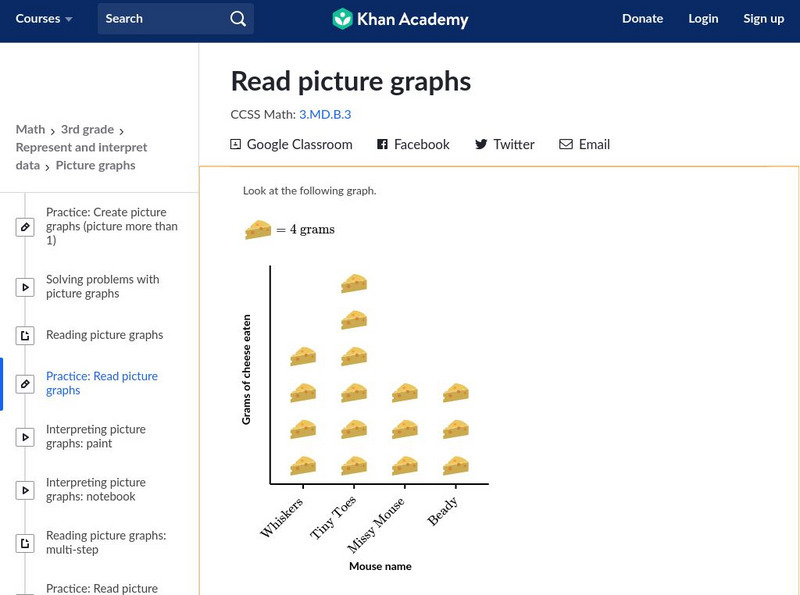
Khan Academy: Read Picture Graphs
Use picture graphs to solve word problems. Students receive immediate feedback and have the opportunity to try questions repeatedly, watch a video or receive hints. CCSS.Math.Content.3.MD.B.3 Draw a scaled picture graph and a scaled bar...
Khan Academy
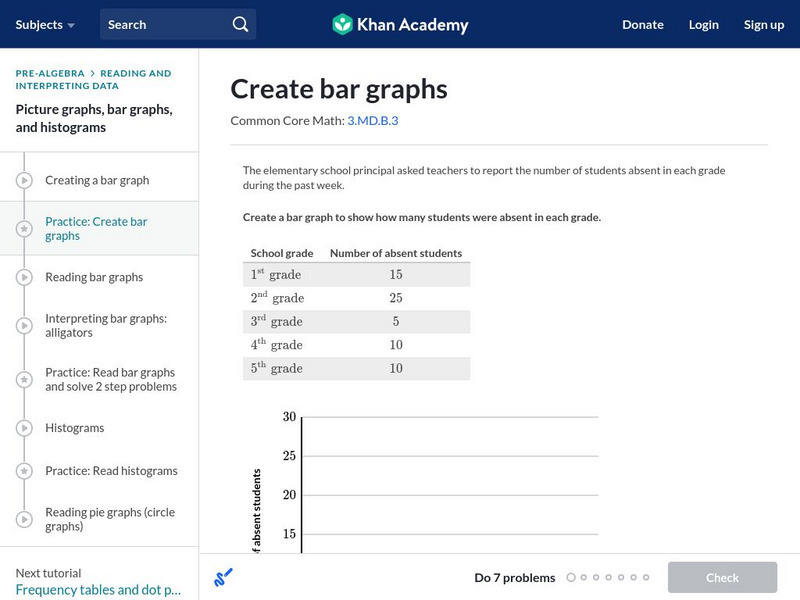
Khan Academy: Create Bar Graphs
Create a bar graph with the data given. Students receive immediate feedback and have the opportunity to try questions repeatedly, watch a video tutorial, or receive hints about creating bar graphs. CCSS.Math.Content.3.MD.B.3 Draw a...
Khan Academy
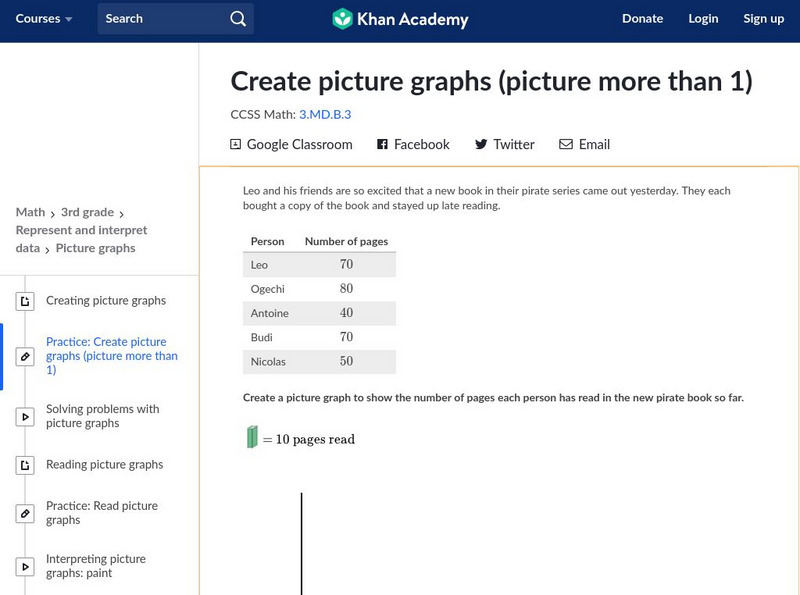
Khan Academy: Create Picture Graphs (Picture More Than 1)
Create and interpret picture graphs. Students receive immediate feedback and have the opportunity to try questions repeatedly, watch a video tutorial, or receive hints about how to create picture graphs. CCSS.Math.Content.3.MD.B.3 Draw a...
Khan Academy
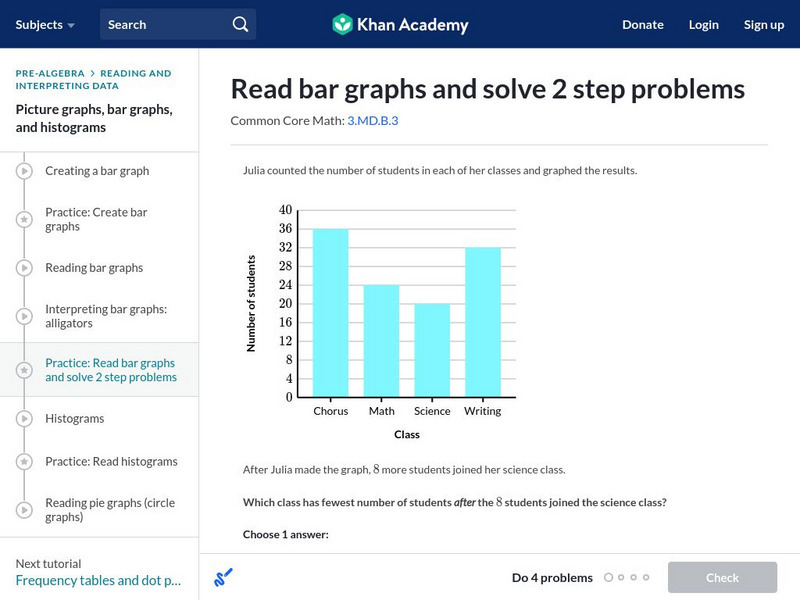
Khan Academy: Read Bar Graphs and Solve 2 Step Problems
Read and interpret a double bar graphs. Students receive immediate feedback and have the opportunity to try questions repeatedly, watch a video or receive hints. CCSS.Math.Content.3.MD.B.3 Draw a scaled picture graph and a scaled bar...


