Curated OER
Graphing
Young scholars investigate graphing. In this bar graph lesson, students view an informational website about graphing, then construct a class birthday bar graph outside with sidewalk chalk. Young scholars choose a survey topic, then...
Curated OER
Yummy Apples!
Students discuss apples and how they are grown. They listen as the teacher reads "Apples," by Gail Gibbons. Students discuss the story. They view several different types of apples and compare their characteristics. Students taste several...
Curated OER
Black History Project
Third graders explore and analyze about famous African-Americans by listening to four picture book biographies. They generate a list of 15 famous African-Americans and then create a survey to rank them according to importance of...
Curated OER
Sunshine Math-1
In this math skills worksheet, students answer 7 questions in which they use various basic math skills. They use number lines, charts, number blocks, a calendar and a ruler to complete this worksheet.
Curated OER
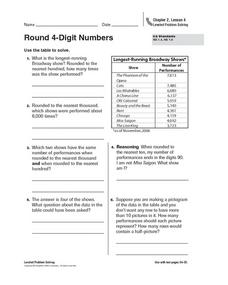
Round 4-Digit Numbers
In this rounding numbers practice worksheet, students sharpen their problem solving skills as they solve 6 story problems that require them to round 4-digit numbers.
Curated OER
Away We Go!
Students study types of transportation. In this transportation lesson, students survey several classes to gather data on how they get to school. Students create a transportation graph.
Curated OER
Clouds
Students explore basic cloud types and the weather associated with each one. In this earth science lesson, students participate in numerous activities including going outside to observe the clouds they see, making a cloud in a...
Curated OER
Chinese Calligraphy
Students explore Chinese calligraphy. In this art and social science lesson, students copy the Chinese character ideograms in order to create words or phrases.
Curated OER
Creating Graphs
This graphing PowerPoint demonstrates how to use graphs to gather information. The slides contain examples of graphs and display the data clearly. This presentation also gives clear directions on how to construct various graphs by using...
Curated OER
Word Search Y3 Data
In this word search worksheet, learners find the words in the word search and then circle them. There are 16 words in the word bank for students to locate. They then try to find any other words that they can. The answers are on the...
Curated OER
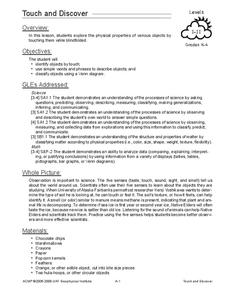
Touch and Discover
Students identify the physical properties of items using the sense of touch. In this touch and discover lesson, students describe items. Students sort items using a Venn diagram.
Curated OER
Favorite Days
Students collect and organize data about themselves. In this data analysis instructional activity, students discuss their favorite calendar dates and explore ways to display the data.
Curated OER
Measuring Snowfall
Students predict the amount of snowfall for the week and measure snowfall. In this measuring snowfall lesson, student use a precipitation gauge to measure the week's snowfall; and analyze the data to determine whether or not...
Alabama Learning Exchange
Meteor or Meteorite
Students differentiate between a meteor and meteorite. They participate in an experiment to discover how the size and weight of an object determines the size of the impact crater. They utilize their math skills by measuring with a ruler...
Curated OER
Tulip Graphing
Students create a graph of tulip growth. In this data analysis lesson, students plant tulip bulbs and use graph paper to begin graphing data on the growth of the tulip.
Curated OER
Tally Time
Students create a tally chart. In this math and health lesson, students discuss healthy foods and create a tally chart showing the number of students who like to eat healthy foods.
Curated OER
Make a Paper Mache Bowl
Young scholars create a paper mache bowl. In this paper mache lesson, students use wallpaper paste, newspapers, and paint brushes to construct a paper mache bowl. Young scholars decorate their bowl with unique designs.
Curated OER
How Do I Measure Up?
Students measure and record weights and heights and compare to others in the class as they find out more about their bodies.
Curated OER
Probability With a Random Drawing
Students define probability, and predict, record, and discuss outcomes from a random drawing, then identify most likely and least likely outcomes. They conduct a random drawing, record the data on a data chart, analyze the data, and...
Curated OER
A Leaf, a Stem, a Root, Oh My!
Students conduct Internet research on plants and complete a WebQuest on vegetable plants. They use a graphic organizer to display their findings, observe actual vegetables and design a salad, noting which part of each plant is included.
Alabama Learning Exchange
What do Plants Need?
Students plant seeds and watch them sprout. Once growing plants are placed in different conditions and students record data about their growth. They graph the data.
Curated OER
Telling Time to 5 Minutes
Students take part in various activities ranging from creating a human clock, to small group problem solving to reinforce the concept of telling time accurately to five minutes on an analog clock.
Curated OER
Rock Art Stencil Printing
Students will create a painting using symbols that were used by Native Americans or symbols they create based on what they have learned about symbols used in Native American rock paintings.
Curated OER
Learning About Our World
Students explore their world using the book "This is the Way We Go to School." They predict information about the story based on the title and pictures. Students label a world map with the names of continents and oceans. They write a set...
Other popular searches
- Data Analysis Pictograph
- Pictograph Worksheet
- Bar Graphs Pictographs
- Pictographs and Bar Graphs
- Tally Charts and Pictographs
- Mystery Picture Graph
- Tally Charts or Pictographs.
- Pictograph Stone Carving
- Making a Pictograph
- Math Pictographs
- Math Lessons Pictograph
- Template of Pictograph


