Curated OER
Student News And Weather Channel
Fabulous! Your 5th graders should love this project. As an ongoing lesson throughout the year students use temperature probes to record outside temperature and then document their data using spreadsheets. They use their weather data and...
Curated OER
Graphically Speaking
Students discover the links between population and Congressional representation. In this government lesson, students research population statistics and create spreadsheets that compare population to the number of Congress members per state.
Curated OER
Super Spreadsheets
Pupils discover information about each of the fifty states in the United States. In groups, they create a spreadsheet organizing the information to show to the class. They discover different ways to display the data and identify the...
Curated OER
Spreadsheets and Database in Social Studies
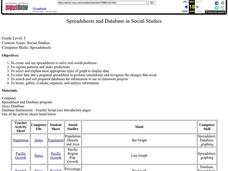
Fifth graders create/use spreadsheets to solve real-world problems, explore patterns and make predictions, select/explain most appropriate types of graph to display data, and enter data into a prepared spreadsheet to perform calculations.
Curated OER
Super Spreadsheets
Students develop a spreadsheet containing statistical data. They describe and interpret the data to make conclusions. They review the differences between an unorganized spreadsheet verses an organized one.
Curated OER
Introduction to Spreadsheets
Sixth graders utilize Excel or other spreadsheet software to create both text and numerical valued columns to produce a Christmas or birthday wish list. They study the difference between text and numerical values for column use and...
Curated OER
How Much Is It?
Students explore foreign currencies. In this foreign currencies lesson, students simulate travel to another country and determine the value of the US dollar compared to other countries. Students use a conversion table and search Internet...
Curated OER
What Temperature Is It?
Pupils use the internet to research information on the average maximum and minimum temperature for a city in their state. They create spreadsheets and enter data to analyze the information, focusing on averages, maximums, minimums and...
Curated OER
Modeling Population Growth
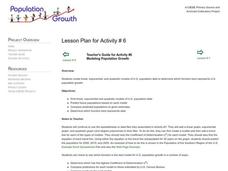
Students create linear, exponential, and quadratic models of U.S. population data to determine which function best represents U.S. population growth. They predict future populations based on each model.
Curated OER
E-mailing the Chamber of Commerce
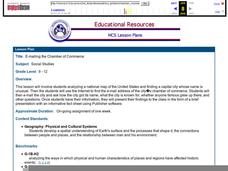
Encourage effective internet research and e-mail correspondence as scholars investigate a US capital city they've never visited to find pertinent and relevant information. They begin by picking a city, then visit that city's chamber of...
Curated OER
What Makes Our Community Special?
Explore websites, complete research, and use technological tools to create a final multimedia presentation on what makes a community special. Learners of all ages work with a partner to research an interesting aspect of their community,...
Curated OER
Graphs! Graphs! Graphs!
Students practice making charts and graphs from data on spreadsheets. Individually, they create a graph representing the latest information on voter registration. They answer questions and analyze the data to end the lesson plan.
Curated OER
History Trifold in Publisher
Students create a timeline of events happening around the world. In this timeline lesson plan, students use Microsoft Publisher to create a timeline of events happening around the world as they live their lives presently.
Curated OER
Class of 2000 - Student Loans
Pupils determine how they will finance their postsecondary education. In this student loan lesson, students create spreadsheets that help them budget their first year of college. Pupils identify methods to fund the budgets and discuss...
Curated OER
Excel Lesson
Young scholars explore data and Excel spreadsheets. They collect data about political candidates. Students enter the data into a chart on Excel. They create a graph using the data and Excel.
Curated OER
Find Yourself with Global Positioning
Students examine different types of new mapping technologies. They use the internet to gather information about mapping and navigation. They create their own global positioning tool and defend it to the class.
Curated OER
State Economy Chart
Fifth graders research and record statistics on the economy of an assigned state. They create a spreadsheet in Excel to report the data and a 3D Pie graph using the Chart Wizard in Excel to represent their states' data.
Curated OER
Publisher Brochures
Students create brochures on subjects they are studying in Publisher. In this nonfiction writing lesson plan, students use Publisher to create a brochure telling all the main ideas of a topic they are studying. Students use text boxes,...
Curated OER
Fire Safety Survey
Students collect data regarding fire safety and create a graph. Working in small groups, they administer a survey to family and friends regarding their attitudes toward fire safety. After data has been gathered, students graph their...
Curated OER
Making a Travel Brochure of a Louisiana Parish
Although the attachments for this travel brochure project are no longer linked, you can still use the idea here and create your own assignment sheet and rubric. Learners choose a parish in Louisiana (or a city in your state) to research,...
Curated OER
World Education Statistics
Young scholars use a spreadsheet from The Digest of Education Statistics and convert the statistics to percentages, and create a chart of their new data. Students discuss their findings about the disparities in educational spending among...
Curated OER
Survey Says...
Students practice taking surveys to answer different questions about radio. In this communications lesson, students brainstorm to create questions they can ask strangers about how often they listen to their radio. Students turn the...
Curated OER
Spreadsheets - WP9/Quattro Pro
Students discover spreadsheet applications using Quattro Pro. They demonstrate basic knowledge and application of hardware, software, and Internet use. They recognize and appreciate the value of recording keeping, data input and data...
Curated OER
Exploring our Community
Students research Los Angeles and its surrounding communities. They create digital presentations of the information they have gathered by answering the question included in the instructional activity.


