CK-12 Foundation
Mean: Harmonic Mean
Let the means live in harmony. With lengths representing the values of a small data set, learners compare the arithmetic mean to the harmonic mean. The pupils determine which value is the most accurate representation of the average of...
CK-12 Foundation
Mental Math to Evaluate Products: Mental Math Halloween Candy
Time to put those mental math strategies into play with an interactive that has learners thinking about how many candies three friends get altogether.
CK-12 Foundation
Mean: Arithmetic Mean
How is a mean affected by changes in data? A well-designed animation allows individuals to manipulate data and watch the effect on the mean. Challenge questions help guide users to conclusions about outliers and skew within data.
CK-12 Foundation
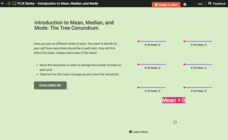
Introduction to Mean, Median, and Mode: The Tree Conundrum
How many trees should we plant? Using an interactive as a manipulative, individuals find the mean, median, and mode for sets of data. They determine the number of trees to plant in each plot of land to reach a statistical goal.
CK-12 Foundation
Two-Sided Stem-and-Lead Plots: Gamers
Which gender spends more time playing video games? Your classes use provided data to answer this question. They first build a two-sided stem-and-leaf plot and then use the display to look for patterns. Guiding questions help them...
CK-12 Foundation
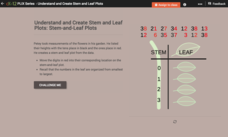
Understand and Create Stem-and-Leaf Plots: Stem-and-Leaf Plots
Explore the advantages to using a stem-and-leaf plot using an online lesson. Learners manipulate an animation to create a stem-and-leaf plot. They then calculate statistics for the data using their display. Guiding questions help them...
CK-12 Foundation
Line Graphs to Display Data Over Time: Strawberry Competition
Take the tediousness out of graphing. Using the interactive tool, learners can efficiently create a line graph from a set of data. They then use the graph to answer questions about specific trends in the data.
CK-12 Foundation
Line Plots from Frequency Tables: Sleep Cycles
Demonstrate the ease of using a frequency table. An interactive lesson allows learners to create a frequency table efficiently. Challenge questions ask your classes to analyze the data represented in the frequency table.
CK-12 Foundation
Understand and Create Line Graphs: Line Graphs
Explore line graphs and their characteristics through an interactive lesson. Scholars follow a set of directions to plot data on a line graph. They then answer questions about the type of variables, minimum and maximum values, and...
CK-12 Foundation
Understand and Create Histograms: Histograms
Determine the shape of weight. Using the interactive, class members build a histogram displaying weight ranges collected in a P.E. class. Scholars describe the shape of the histogram and determine which measure of central tendency to use...
CK-12 Foundation
Understand and Create Histograms: Histograms
Tally ho! Represent the frequency of ages at school. Pupils finish a tally chart to match the frequencies of ages at school. Using the frequencies, the learners create a histogram. With the aid of the histogram and the frequency table,...
CK-12 Foundation
Understand and Create Histograms: Car Sales
Create a history of car sales. Pupils create a histogram/bar graph to show the number of car sales made during the week. Using the data display, learners calculate numerical summaries of the data and find the percent of cars sold during...
CK-12 Foundation
Multiple Bar Graphs
I scream, you scream, we all scream for ice cream bar graphs. Pupils create a multiple bar chart to represent the sales of ice cream products during the first week of summer. Using the chart, learners find the day that each of the...
CK-12 Foundation
Double Bar Graphs: Favorite Cookies Chart
It's just the way the cookie crumbles. Using the data from a class poll, learners create a double bar graph showing favorite cookie types. The pupils compare favorites between boys and girls with the aid of their graphs, then they make...
CK-12 Foundation
Single Bar Graphs: Hockey Teams
Raise the bar for hockey fans. Using data about favorite hockey teams, pupils build a bar graph. They use the information from the graph to make comparisons and solve one- and two-step problems.
CK-12 Foundation
Displaying Categorical Variables: Spending Habits
Bar or circle graph—which is best? Given a circle graph and a total amount of money earned, pupils calculate the amount of money in each category. Learners use the calculated amounts to create a bar graph and compare the two displays.
CK-12 Foundation
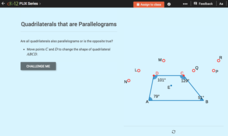
Parallelogram Proofs: Quadrilaterals that are Parallelograms
What conditions must be met for a quadrilateral to be a parallelogram? A slider interactive allows individuals to move the vertices of a quadrilateral. They answer questions that prove whether a given quadrilateral is a parallelogram.
CK-12 Foundation
Identify Line Types: Intersecting and Parallel Lines
Navigate your way through a lesson on types of lines. Individuals drag line segments to illustrate paths between pairs of houses on an interactive map. They determine if these line segment pairs are intersecting or
parallel.
CK-12 Foundation
Identify Line Types: Identify Types of Lines
If lines aren't parallel or perpendicular, then what are they? An interactive lets users rotate a line to change its orientation
with respect to another line. It then indicates whether the
lines are parallel, perpendicular, or...
CK-12 Foundation
The Real Numbers: Adding Electrons
Get a charge out of a great resource! Scholars use an interactive to explore addition and subtraction of integers. They add or remove electrons in an atom model to consider its charge.
CK-12 Foundation
Order Real Numbers: Pie Baking Contest
Time is on your side. Scholars plot three points on number lines with different time units to represent the time it takes three people to bake pies. They determine the fastest baker and the difference in times between the bakers.
CK-12 Foundation
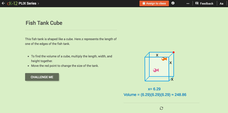
Algebra Expressions with Exponents: Fish Tank Cube
There's nothing fishy about this resource. A slider interactive lets users adjust the side length of a fish tank cube. It aids in seeing changes in the volume and how to express the volume using an algebraic expression.
CK-12 Foundation
Inequalities that Describe Patterns: Freezing Cold Comparison
Don't freeze out the interactive on inequalities from your lesson plans. Young mathematicians use an interactive thermometer and number line to compare freezing temperatures. Inequalities help express these comparisons.
CK-12 Foundation
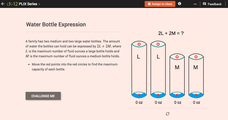
Evaluate Expressions with One or More Variables: Water Bottle Expression
Fill your mind as you fill virtual water bottles. Pupils use an interactive to find the amount of water that can fit in given containers. Writing and evaluating an algebraic expression helps with this task.


