Curated OER
Surname Survey
Students use data from the U.S. Census Bureau to determine whether last names in a local phone directory reflect the Census Bureau's list of the most common surnames in the country. In this surnames lesson plan, students use the Internet...
Curated OER
Geometry Finding Pentominoes
Students explore the characteristics of geometric shapes. For this geometric shapes lesson, students use tiles to draw pentominoes. Students participate in various learning center activities focused on configuring pentominoes.
Curated OER
A Look At Rocks
Students write letters to organizations, such as United States Geological Society, to find out more about rocks. Students write about a pretend time they found a magic pebble. Students calculate distances to travel to see various...
Curated OER
Shake, Rattle, and Roll
Students make an earthquake simulator and test their structure to see if it lasts through the earthquake. In this earthquake lesson plan, students make a structure and test and record the results from an earthquake simulator made out of...
Curated OER
Locating the Salt Front
Students use Hudson River salinity data to create a line
graph that shows the location of the salt front, and use math
skills to explore how this location varies over time. They use the graph to estimate the location of the salt front...
Curated OER
Mapping an Artifact
Young scholars copy a present day artifact onto graph paper. In groups, they decide the scale of the drawing and create the picture using specific graphing points. They are also given photographs in which there are no graphing points and...
Curated OER
Pattern Block Activities
Students practice various math skills by using manipulative activities. In this math manipulative lesson, students sort shapes, build hexagons, and build shapes using manipulatives. These activities would be great for parent ed or...
Curated OER
Understanding Cloud Formation
Students read and relate the poem, "Clouds" by Aileen Fisher to a demonstration on cloud formation. They create clouds in jars using ice water and matches then discuss the ways clouds can be used to predict weather.
Curated OER
The Bigger they Are . . .
Pupils do a variety of data analyses of real-life basketball statistics from the NBA. They chart and graph rebounding, scoring, shot blocking and steals data which are gathered from the newspaper sports section.
Curated OER
Parts of a Whole
Fourth graders explore fractions through the analysis of various paintings. They view and discuss paintings by Picasso and Seurat, discuss the fractional examples in the paintings, and create a bar graph.
Curated OER
The Weather and Recess #157
Students track the daily weather at recess time for a number of weeks. They design a bar graph of the different types of weather. They discuss how weather changes affect recess time. They write a list of optional recess activities for...
Curated OER
Highs and Lows
Students use email to chart weather patterns and then graph their findings. For this weather patterns lesson, students chart their weather for a week at the school. Students then use email to find temperatures at a variety of locations....
Curated OER
Ratios
Fourth graders complete a taste test of different sandwiches, rate them, and then put them in a ratio graph. In this ratio lesson plan, 4th graders write what they learned about ratios after this activity.
Curated OER
Finding the Salt Front
Students discuss definitions of estuary, salinity, and the salt front. They listen as the teacher explains the Hudson River Miles and ways the upriver and downriver sections relate to the north and south. Students graph the salt front...
Curated OER
Measuring the Speed of a Wave
Students create an experiment in which they measure the speed of a wave and record the data in a graph. They work in small groups to write the procedure for the experiment and share it with another group for cross checking of the...
Curated OER
Hare and Lynx Population
Fourth graders study changes in animal population. In this graphing instructional activity, 4th graders create graphs from information read to them about hares and lynx populations. They will describe patterns of change in the graphs and...
Curated OER
PASS the Arts
Learners explore math and art concepts, create digital art examples of the concepts, and incorporate these works into a PowerPoint portfolio with explanation and analysis.
Curated OER
Kansas Foods A Data and Probability Investigation
Students study a number of food products and anticipate which are derived from Kansas crops. They make a list of words associated with the food stuffs and graph the results.
Curated OER
Let it Grow, Let it Grow, Let it Grow
Young scholars investigate, through a hands-on activity, in which type of soil a bean seed grows best. They create a bar graph representing each plant's growth in different soils.
Curated OER
Reduce and Reuse
Students conduct a lunch waste audit by recording each item they throw away at lunch. They graph class lunch waste. They use this information to devise a plan of action to reduce lunch waste. There is also an activity to make paper.
Curated OER
Trade Missions
Students research the products of countries in Central and South America. t research which products from the countries they represent are imported to the United States. They create tables and/or graphs to indicate annual totals.
Curated OER
Rubber Gardens
Students recycle discarded automobile tires and create gardening sites for limited space areas.
Curated OER
Cinderbank
Fourth graders identify major components of a "Cinderella" story in order to create a database.
Curated OER
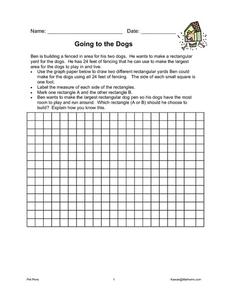
Going to the Dogs and Horsin' Around
In these rectangle perimeter worksheets, students complete two worksheets for perimeter. Students answer four questions for each rectangular pen they create for a dog and horse pen.


