Curated OER
How Strong Is It?
Learners investigate the adhesion conditions and surface for using post it notes. For this post it notes lesson plan, students discover the adhesive properties, test the notes for strength, and interpret data and draw conclusions.
Curated OER
Graphs Galore
Fourth graders conduct surveys to collect data. They analyze and interpret the data, then determine which type of graph is appropriate for the data. Students use the data to make predictions, discover patterns and draw conclusions...
Curated OER
Family Life in the 1830s
Students compare and contrast family life today with family life in the 1830s. They conduct research on Old Sturbridge Village, read primary source documents, and develop a list of generalizations comparing/contrasting families of the...
Curated OER
Fibers Lesson Plan
Young scholars explain how to use a light microscope, describe how to care for a microscope, and solve a forensic science problem, using a microscope to analyze data and draw conclusions.
Curated OER
Literacy as a Force in the World
Students research and compare economic factors and data mining in Nepal. Students look at data to determine how the Nepalese quality of life compares to other countries and predict whether the literacy rate indicates or influences the...
Curated OER
Clouds and the Weather
Fourth graders analyze the relationship of clouds and local weather. Students also observe and record cloud data and weather conditions daily as they research different cloud types. The data is analyzed looking for trends in daily...
Curated OER
Mapping Possible Solutions
Fourth graders propose possible sites for the heart of Florida state capital by mapping collected data onto a Florida state map and recording data in a Travel Log.
Curated OER
Different! Diverse! Dynamic! Lesson 1: Late Bloomers
Students examine how people grow and mature at different rates. They create a graph and a timeline to organize the data they collect.
Curated OER
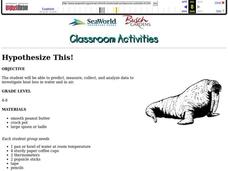
HYPOTHESIZE THIS!
Students predict, measure, collect, and analyze data to investigate heat loss in water and in air.
Curated OER
Draw an Alien in Natural Habitat
Students apply prior knowledge of living things, structures of living things and how living things sense and respond to their environment. In this habitat lesson plan, students review the basic needs of organisms to survive. Students...
Curated OER
Making a Thermometer
Students observe a demonstration of how a thermometer functions. They apply the scientific method while determining which of three cups hold the coldest water. They write a hypothesis before conducting the experiment and gather data.
Curated OER
Measuring the Speed of a Wave
Young scholars create an experiment in which they measure the speed of a wave and record the data in a graph. They work in small groups to write the procedure for the experiment and share it with another group for cross checking of the...
Curated OER
Class Final Report - Global Sun Temperature Project
Students reflect on the data they have analyzed during the Global Sun Temperature Project. They use the project website as a resource for their observations, draft a class report and post it on the Internet.
Center for Learning in Action
Density
Explore the concept of density within states of matter—gases, liquids, and solids—through a group experiment in which young scientists test objects' texture, color, weight, size, and ability to sink or float.
Curated OER
Introduction to Bar Graphs Lesson Plan
Students organize and interpret data using bar graphs.
Curated OER
Scavenger Hunt
Students collect data about lighting conditions around a room using a light sensor and RCX. They use software to upload and analyze the data in order to draw conclusions about light intensity in the room.
Curated OER
Fish Communities in the Hudson
Students use tables of fish collection data to draw conclusions about where fish live in the Hudson Estuary. Given available data they interpret organized observations and measurements and recognize simple patterns, sequences, and...
Curated OER
Enquiry 1: Introduction
Students explore war memorials from the First World War. After visiting a local war memorial, students research the soldiers listed. As a class, they discuss the the impact of the war on their community. Students research their...
Curated OER
One Square Meter
Learners examine various ecosystems using scientific inquiry. Using the local area, they assess the characteristics and conditions in one square meter. They report their findings in the form of a survey map and data sheet. They...
Curated OER
Riparian Zones Grades 4-8
Students examine and analyze the Riparian Zones found on the edges of streams and lakes. They assess why those are such valuable ecosystems and then conduct actual field research on riparian zones and conclude by drawing conclusions from...
Curated OER
Where Do Green Plants Get Energy?
Fourth graders realize that plants need light, water, and carbon dioxide to carry out photosynthesis. They participate in groups of 4 to plant (with materials provided) a test group of beans to compare to the control group, write a...
Curated OER
Palace for Pill Bugs
Learners build a palace fit for pill bugs. In this experimental design lesson, students design an experiment to determine which shelter is preferred by the pills bugs. Learners are creating a testable hypothesis, collecting data,...
Curated OER
Where Did That Come From?
Fourth graders participate in a scavenger hunt. They locate specified items, finding the country origin. Students collect and organize the data, marking each country on a map. After researching the results, 4th graders write an analysis...
Curated OER
Termite Trails
Students observe the behavior of termites and draw conclusions about their behavior. They record data as to termite behavior and recognize elements in the experimental design which must include a hypothesis.


