Curated OER
Thanksgiving Feast (Read the Charts)
Students practice reading charts about foods country of origin. They interpret information and answer questions related to charts. They discover how food production adds to the economy.
Curated OER
Creating Graphs from Tables
Students interpret data from tables and then create a graph to show the same data in a different organization.
Curated OER
My Test Book: Tally Charts
For this online interactive math worksheet, students solve 10 problems that require them to read and interpret tally chart data. Students may submit their answers to be scored.
Curated OER
Apple Adjectives
Study different apple varieties and use appropriate adjectives to describe them. Learners alphabetize both the apple names and the adjectives before creating spreadsheet, bar, and pie graphs. A mix of language arts, technology, and...
Curated OER
Quarter, Nickel, Dime....
An engaging game called, "Quarter, Nickel, and Dime" is presented in this math lesson. Players are given an envelope with slips of paper that represent the three coins. In pairs, they play the game 18 times, and the whole class charts...
Curated OER
Piece of Pie Chart
In this math worksheet, students examine a pie graph which shows a student's homework over 2 hours. Students read the information, then use a pie chart template (divided into 24 parts) to make their own homework chart.
Curated OER
M&M Math
Learners sort a bag of M&M candies according to color using a sorting mat. They count M&M candies. They compare the number to their prediction then students create tally charts.
Curated OER
Make a Tally
In this tally chart worksheet, students read the word problems and use the information within the problem to make a tally chart. Students use the tally charts to help them finish and solve the word problem.
Curated OER
Balloon Graphing
Fourth graders explore data, charts and graphs. They create graphs using titles, labels, axes, intervals, and scale correctly. Students enter their data into Excel and create a graph.
Curated OER
Snack Attack
Students design charts, tables, graphs, and pictographs to analyse the types of snacks in a bag.
Curated OER
Higher Order Thinking (H.O.T.) Lesson - BIG E
Fourth graders work with patterns while using large numbers. In this patterning lesson, 4th graders go over the definitions of the words: predict, estimate, attendance, increase, and decrease. They complete worksheets in which they track...
Curated OER
Statistics and Graphing with Accelerated Math
Students create charts and graphs, using a spreadsheet program, of their results from their accelerated math lessons. Students discover how graphs can be used to interpret data in our everyday lives as well as how several different...
Curated OER
Mathematics Within: Bar And Pie Graphs
Students compare and contrast the use of bar and pie graphs with the same data. They create a data set by surveying all students in the class using sticky notes to make a table on the board. Then, each student creates a bar and pie graph...
Curated OER
Jim, Tony, and Frank-The School Fund-raiser (Graphing)
In this graphing worksheet, students view a pie chart. Students use their graphing knowledge to interpret the pie chart and answer ten questions. There is an answer sheet.
Curated OER
Free Printables: Easy Graphs
In this counting and charting activity, students compete the chart using either colors or the stickers provided. Teachers can determine the subject of the chart by using the activity generator.
Curated OER
Circle Graph-Fractions
In this circle graphs activity, students determine what fraction of a pie graph is a designated color. Answers are included on page 2.
Curated OER
Popping Problems!
Turn your math lesson into a carnival game with this fun, outdoor activity. After reviewing the concept your class will be practicing briefly, split your class up into teams and head outdoors. These teams work to solve math questions and...
Curated OER
Plotting Data on a Graph
Students investigate graphing. In this graphing lesson, students survey the class and create graphs to reflect the data collected.
Curated OER
Handling Data/Measures of Average - Finding the Mean from Displayed Data
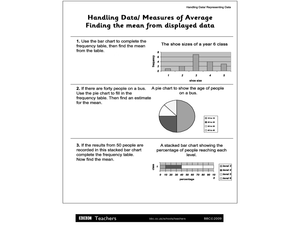
In this mean and average worksheet, students use the bars and charts to help them find the means using the given data. Students solve 3 problems.
Curated OER
Graphs Galore
Fourth graders conduct surveys to collect data. They analyze and interpret the data, then determine which type of graph is appropriate for the data. Students use the data to make predictions, discover patterns and draw conclusions...
Curated OER
M&M Graphing and Probability
Students create a variety of graphs. They count, sort, and classify M&M's by color and record data on a chart. They use data from the chart to create pictographs, bar graphs and circle graphs. They analyze data and determine...
Curated OER
The Numbers Tell the Story
Students demonstrate how to gather and interpret statistical data. In this data analysis instructional activity, students search for statistics on the health effects of smoking and place the information into charts. Students create these...
Curated OER
Probability Using M&M's
Students estimate and then count the number of each color of M&M's in their bag. In this mathematics lesson, students find the experimental probability of selecting each color from the bag. Students create pictographs and bar graphs...
Curated OER
Counting Candies
Students count, sort, and classify jellybeans by color. They use their data to create a bar graph. Students are given a small bag of jellybeans, and a worksheet on Counting Candies Tally Chart. They work in small groups. Students are...


