Curated OER
Countdown to Disaster
Students discover the potential dangers of weather in their hometown. In this environmental lesson plan, students research Hurricane Hugo and the devastation it caused South Carolina in 1989. Students record weather data from...
Curated OER
Problem Solving and Puzzles: 3
Your class can use this to warm up or to discuss their problem solving strategies. They review the 8's times tables, relate the multiplication problems to division, then use a chart to solve a word problem involving money.
Curated OER
What Are Your Favorite Apples?
In this tally worksheet, students take a survey to determine the favorite apple. They write tally marks beside the apple chosen. For elementary students, this worksheet may be used for counting purposes and to reinforce what a tally mark...
Curated OER
Show Me!
Students analyze and interpret graphs. In this graphing lesson, students view a video and construct their own graphs (line, circle, bar) from given sets of data.
Curated OER
Local Traffic Survey
Students conduct a traffic survey and interpret their data and use graphs and charts to display their results.
Curated OER
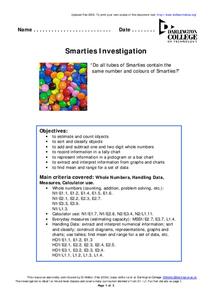
Smarties Investigation
In this math worksheet, learners participate in an investigation of Smarties candy. For example, students estimate how many candies they have in each color, count the actual number, and record the information in a tally chart.
Curated OER
Life Expectancy at Birth
Students create a line graph on the life expectancy for males and females in Canada. In this math and health lesson plan, students review table and graph terminology, create line graphs, and analyze the differences in life expectancy...
Curated OER
Part of a Whole Group One
For this fractions worksheet, students solve word problems where they solve problems about parts of whole groups using pictures, charts, and more. Students complete 4 problems.
Curated OER
A Thanksgiving Survey
Young scholars take a survey then use the information gained from the survey to help plan a typical Thanksgiving dinner for our last day of class. They create a graph which corresponds the the data gathered during interviews.
Curated OER
My Test Book: Stem and Leaf Plots
For this math skills worksheet, students solve 10 multiple choice math problems regarding stem and leaf plots. Students may view the correct answers.
Curated OER
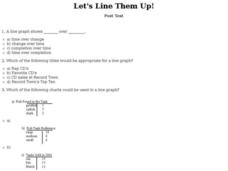
Let's Line Them Up! Post Test
In this line graphs activity, students answer multiple choice questions about line graphs. Students complete 10 multiple choice questions.
Curated OER
Critter Encounter Chart
Students record data found at an assigned web site. In this data collection lesson, students access an assigned web site in order to complete a data chart about animals they see. They travel to different sections of the web site to find...
Curated OER
The Lake Effect
Fourth graders conduct an experiment demonstrating the effects of water and air temperature on precipitation. They create graphs demonstrating their findings using Claris Works for Kids.
Curated OER
Lesson 3: Seven Day Road Trip
Students plan a seven day road trip. In this travel lesson, students plan a driving trip that includes five major cities or attractions in Florida or another state of their choice. They show the trip on a map, calculate distances that...
Curated OER
Jelly Bean's Galore
Students investigate the origins of the Jelly Bean. They complete a Scavenger Hunt using the jellybean website. Pupils create a bar graph using information collected about jelly beans. Students discuss the time of year that Jelly Beans...
Curated OER
T-Shirt Lettering
Students determine the cost of a t-shirt using a variety of mathematical operations to solve problems. Then they use a spreadsheet to calculate the cost of lettering a t-shirt and display this information in a graph.
Curated OER
Delicious Graphing
Fourth graders sort trail mix by type and use that information to create different types of graphs for comparing.
Curated OER
Generate Measurement Data Word Problems
Plot data for three word problems, each with a table of data. Learners create line plots for these, all of which have only single-digit whole numbers. The large text and few number of problems make this ideal as a whole-class warm up....
Curated OER
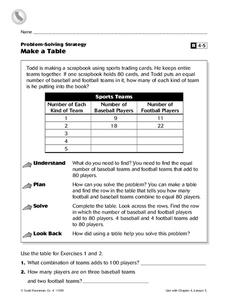
Make a Table
In this charting worksheet, 4th graders complete a table. Using the information provided, students fill in the missing data and complete 2 short answer questions.
Curated OER
Changing Fractions: Worksheet 1
In this math activity, students first write the fraction of the shaded area on the circles. Students then draw lines connecting markers on the perimeter of the circle and write the fraction using the new fraction that is shown.
Curated OER
Virtual Field Trip / Route, Mileage and Gasoline Cost Graphs
Students use a spreadsheet program to graph and compare milage, gasoline costs and travel time for two travel routes in their virtual field trip in Michigan. They determine the most economical route based on the graphs and calculations.
Curated OER
Graph Made Easy-Pre Test Questions
In this graphing pre test learning exercise, students complete a set of 10 multiple choice questions. Page is labeled as a pretest, an answer link is provided.
Curated OER
Graphs Abound
Students create a survey for their classmates to collect data on their favorite foods, eye color, pets or other categorical data. They compile the data from the survey in a table and then make a bar graph of each category using a web tool.
Curated OER
Let's Graph It!
Students graph the height of others in centimeters and inches, find the slope of line in order to calculate the conversion factor between centimeters and inches.


