Curated OER
Using Excel To Teach Probability And Graphing
Students engage in the use of technology to investigate the mathematical concepts of probability and graphing. They use the skills of predicting an outcome to come up with reasonable possibilities. Students also practice using a...
Curated OER
Weather Graph
In this graphing worksheet, students read the average monthly maximum and minimum temperatures in Paris and use them to complete a color coded line graph. Students graph 24 figures.
Curated OER
Math and Architecture Lesson
Students examine relationship between architecture and math, explore importance of inventions to humanity and relate math and architecture to their school and home by creating graphs, tables, and presentations showing development of...
Curated OER
Math: Skyscraper Comparison
Young scholars examine skyscrapers by conducting Internet research and by creating and interpreting graphs. After reading the book, "Skyscraper," they discuss reasons why the structures are built. Once they have researched the tallest...
Curated OER
Graph Ordered Pairs of Integers
This instructional activity is basic, but provides a variety of ways for students to practice identifying points on a coordinate graph. Students start by identifying points in various quadrants, and end up naming ordered pairs.
Curated OER
Creating a Spreadsheet and Graph
Students create graphs in Excel. In this spreadsheet lesson, students input data into spreadsheet cells then use the graphing feature of the Excel program to produce colorful graphs of the data. The directions to create the...
Curated OER
M&Ms; Line Plots and Graphing
Students, using small individual bags of M&Ms, engage in activities including; estimating, sorting, graphing, mean, median, mode, fractions, percentage, and averaging.
Curated OER
Skittle Math
In this skittle math worksheet, young scholars sort skittles by color and create a bar graph for each color of skittle. Students also answer comparison, ratio, and relationship questions about the skittles.
Curated OER
Math! What's It All About?
Students explore what it means to solve problems and communicate in real life situations. They recognize math in a variety of real life materials. Also, they determine what procedures they use to solve a problem and what areas of math...
Curated OER
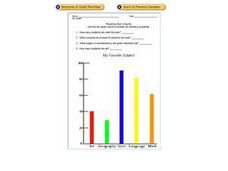
Reading Bar Graphs: My Favorite Subject
In this bar graphs worksheet, students analyze a bar graph about favorite school subjects. Students use the information on the graph to answer 7 questions.
Curated OER
Professor Panda's Pizza Graph
In this data analysis worksheet, students answer 11 questions using a bar graph that was constructed from the answers to a survey about pizza toppings. They use a secret code to determine the best place to have a pizza.
Curated OER
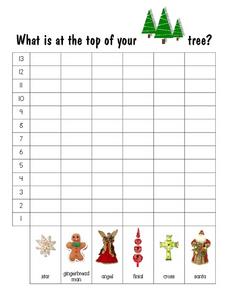
What Is At the Top of Your Christmas Tree? Bar Graph Recording Sheet
In this Christmas bar graph recording worksheet, students receive a number and record what is placed at the top of their Christmas tree. They chose between a star, a gingerbread man, an angel, a finial, a cross or a Santa figure. There...
Curated OER
M&M Graphing
Fourth graders name colors of M&Ms and record answers. They estimate number of M&Ms of each color found in a typical package of M&Ms on piece of paper.They record information on sheet of paper and create a spreadsheet. paper.
Mathwire
Graph Each Ordered Pair - Five Worksheets
This resource is composed of five separate worksheets on ordered pairs. After plotting each ordered pair, learners label each point, connect the points to create a figure, identify the polygon type, find the perimeter and area of the...
Curated OER
Activity: An Experiment with Dice
Roll the dice with this activity and teach young mathematicians about probability. Record outcomes for rolling two number cubes in order to determine what is most likely to happen. Graph the data and investigate patterns in the results,...
Mathed Up!
Pictograms
Young mathematicians read, interpret, and complete a variety of real-world pictograms. Each question includes a key and information to complete the graphs.
Curated OER
Applied Science - Science and Math Lab 4B
Learners experiment with the combination of vinegar and baking soda. In this applied science lesson, future scientists compare qualitative and quantitative data collected from their exploration. Then they work together to analyze and...
AIMS Education Foundation
Classroom Olympics
As the Summer Olympics are approaching, incorporate Olympic-type games into the classroom. From straw javelin to cotton ball shot put, these games are sure to keep leaners engaged. The best part is that there is math involved! Pupils...
Curated OER
My Test Book: Reading Graphs
In this online interactive math skills worksheet, students solve 10 multiple choice math problems that require them to read and interpret graphs. Students may view the correct answers.
Curated OER
Transportation Math
Students explore the concept of exponents. In this exponents lesson, students evaluate various bases to powers. The bases to a given power are in the context of miles driven, stops on a route, and minutes spent in...
Curated OER
Bar Graphs
In this bar graph worksheet, learners complete math problems having to do with different bar graphs. Students complete 10 problems for 10 different graphs.
Curated OER
Line graphs
In this line graphs worksheet, learners read 2 line graphs and answer short answer questions about them. Students answer 5 questions for each graph.
Curated OER
RCX Car Line Graph
Students develop a line graph based on distances that an RCX car drives in specified amounts of time. They then are given a specific amount of time for the car to drive and be asked to extrapolate the car's distance from the graph.
Curated OER
Graphs and money
In this graphs and money worksheet, students complete word problems about different kinds of graphs and money in those graphs. Students complete 10 multiple choice problems.
Other popular searches
- Charts and Graphs Math
- Hidden Picture Math Graphs
- Misleading Graphs Math
- Powerpoint Math Graphs
- 1st Grade Math Graphs
- Math Graphs 4th Grade
- Math Reading Graphs
- Animals Math Graphs
- Math Graphs Grade 1
- Creating Math Graphs
- Math Graphs Using M&ms
- Math Interpreting Graphs


