Teachers Network
A World of Symmetry: Math-Geometry
Define and identify the three basic forms of symmetry translation, rotation, and glides with your class. They cut out and arrange paper pattern blocks to illustrate symmetry, create a Cartesian graph, and design a rug with a symmetrical...
Scholastic
Study Jams! Circle Graph
Over a pizza dinner, RJ and Mia discuss how to use a circle or pie graph to represent data. After viewing, data analysts can use a Test Yourself feature to assess their own understanding. This is ideal for use in a flipped classroom lesson.
Curated OER
M&M’s Math Worksheet
Who knew you could cover prediction, histograms, fractions, decimals, data collection, and averages (mean, median, and mode) all with a bag of M&M's®? Here's a fantastic set of worksheets to help you make candy a mathematical journey...
Curated OER
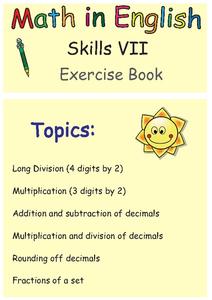
Math in English Skills VII Exercise Book
A great way to help struggling learners with long division is to provide graph paper. These worksheets provide handy boxes to help kids keep all that great work in the right order. It also provides over 20 worksheets to help pupils...
Curated OER
Drive the Data Derby
Three days of race car design and driving through the classroom while guessing probability could be a third graders dream. Learn to record car speed, distances traveled, and statistics by using calculation ranges using the mean, median,...
Curated OER
Button Bonanza
Collections of data represented in stem and leaf plots are organized by young statisticians as they embark some math engaging activities.
Curated OER
Double Bar Graphs - Homework 7.1
Your learners have seen basic bar graphs, but do they have experience reading double bar graphs? This worksheet details how to draw a double bar graph and provides an example with six accompanying questions. The final question asks...
Curated OER
How to Draw a Bar Chart Correctly
Your class has gathered their data, so what's the next step? They need to display and analyze their data, and a bar chart is a perfect tool for the job. This resource provides the step-by-step instructions those kids need to construct a...
Curated OER
Read and Make a Bar Graph
In this bar graph activity, students learn how to read bar graphs by using the information in each word problem and making bar graphs with the information to help solve the problems.
Curated OER
Double Bar Graphs - Practice 7.1
In this double bar graph worksheet, students make a double bar graph from given information, then solve related problems in addition to 2 test prep problems. Houghton Mifflin text referenced.
Curated OER
Creating Tables and Bar Charts
A great way to introduce the concepts of data collection, bar charts, and data analysis. Learners see how their teacher used the data from fifty of her friends to construct a bar chart showing their favorite toys.
Curated OER
Graph Paper Patterns
Young artists divide a piece of graph paper into sections using rectangles, squares, and triangles. They then fill each section with patterns of shape and color. Elementary graders describe how their patterns are organized. Secondary...
Curated OER
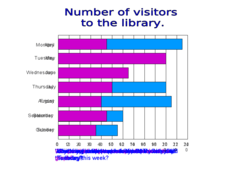
Bar Chart Questions
This resource includes two useful slides. Slide 1 is a bar chart that shows the number of people who went to the library in a weeks time, for discussion. Slide 2 includes a similar chart along side 10 data analysis questions for learners...
Curated OER
Graphing the Population Explosion of Weeds
Learners are introduced to the seed cycle and draw the specific steps. In groups, they identify the human barriers to the spreading of weeds. After calculating the rate of spreading of the Yellowstar Thistle, they create graphs to see a...
Curated OER
Graphing Toys!
Jason, Michelle, Sofia, and Willis all have a variety of toys. Use the chart provided to graph how many toys each child has. Who has the most toys? Who has the least? Help your learners study the graphs they create to better understand...
Curated OER
Algebra: Coordinates and Straight Line Graphs
Young mathematicians review what they have previously learned about coordinates and straight line graphs. Then, they access an interactive component within the lesson to gain more practice with this skill. Additionally, there are two...
Curated OER
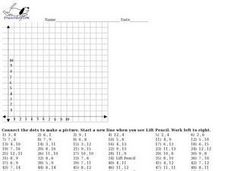
Graph Picture (Coordinate Pairs)
Coordinate graphing on a grid is the focus of this worksheet. Young mathematicians plot 42 coordinate pairs on a graphing grid, then connect the dots to make a picture. A fun way to get your learners involved in graphing!
Curated OER
Jelly Bean Math Activities
Using jelly beans as math manipulatives can be a tasty way to introduce and reinforce math concepts. Regardless of the time of year, candy can be used to excite learners and facilitate a wide variety of mathematical concepts.
Curated OER
Graph Picture (Coordinate Pairs) 2
Looking for an engaging way to encourage your class to practice graphing coordinate pairs? This might be the activity you are looking for! For this worksheet, learners create a picture by plotting 54 coordinate pairs on graph and then...
Curated OER
Graph Picture (Coordinate Pairs) 3
Here is a very good coordinate graphing activity. Learners practice graphing by plotting 58 coordinate pairs, then connecting the dots to reveal a picture. This resource could be used as an in-class activity or a homework assignment.
For The Love of Teaching Math
Sink Cap’n K!
Turn a lesson on the coordinate plane into a class game of battleship with this fun math resource. Providing two coordinate grids and and places to fill in the ordered pairs that are guessed, this activity is a great way...
Curated OER
Graph Paper
In this blank graph paper worksheet, students use the gridded sections marked off with the numbers 1-10 on the x and the y axis as directed by their teachers.
Curated OER
Create a Graph Online
Scholars create colorful bar, line, or pie graphs. They decide on a survey question to ask or a type of data to gather. From there, they collect information and data. They display this data in bar, line, or pie graphs that they create...
Curated OER
Math--Pictures and Bars--Learning About Graphs
What is a graph? What does it tell us? How do you make one? These are all questions that are answered in the included packet. It's a great introduction to graphing for young learners!
Other popular searches
- Charts and Graphs Math
- Hidden Picture Math Graphs
- Misleading Graphs Math
- Powerpoint Math Graphs
- 1st Grade Math Graphs
- Math Graphs 4th Grade
- Math Reading Graphs
- Animals Math Graphs
- Math Graphs Grade 1
- Creating Math Graphs
- Math Graphs Using M&ms
- Math Interpreting Graphs


