Curated OER
Beginning Graphs in MS Excel
Students practice creating graphs in Microsoft Excel. In this technology lesson, students conduct a random survey and collect data. Students use the Microsoft Excel program to create a bar graph of the data.
Curated OER
How to Graph in Excel
Fourth graders construct data graphs on the Microsoft Excel program. In this statistics lesson, 4th graders formulate questions and collect data. Students represent their results by using Excel.
Curated OER
Line Graphs
In this line graphing worksheet, students read a table showing items four children "posses" and plot graphs for each child showing the distribution of objects they each have. Students plot four line graphs.
Curated OER
Learn How to Graph
Students examine various types of charts and discover how to construct a line graph. Using graph paper, they construct a graph displaying weight loss over a five-year period. They draw copnclusions from the completed graphs.
Curated OER
Shaquille O'Neal Hand & Foot Span
If Shaquille O'Neal wears a size-20 shoe, how big are his hands? Learners will use the average ratios of foot length to hand span to calculate the hand span of Shaq, but first, they have to collect the data! They will...
Scholastic
Study Jams! Ordered Pairs
Using an amusing amusement park, Sam describes how it is a coordinate plane and how to graph an ordered pair. Perfect for beginners, the animation moves on to point out a tip using the first quadrant of an empty coordinate plane.
ARKive
Handling Data: African Animal Maths
Handling and processing data is a big part of what real scientists do. Provide a way for your learners to explore graphs and data related to the animals that live on the African savannah. They begin their analysis by discussing what they...
Scholastic
Study Jams! Line Plots
Data analysts are guided through the arrangement of whole-number data onto a line plot by listening and viewing a high-quality, animated, and narrated set of slides.
Curated OER
Probability and Statistics
Elementary schoolers choose from a host of activities to investigate probability and statistics. They complete worksheets, create 3-D graphs, and play graph bingo. They make weather predictions and list all the possibilities before going...
US Department of Commerce
Featured Activity: Population Change Over Time
Keep track of a state's population. After a brief discussion on how population data is used for funding, individuals look at population changes over time. Pupils find the population of two states using three different censuses. They then...
American Statistical Association
The Taste of Yellow
Does lemonade taste better when yellow? A tasty experiment has scholars determine the answer to the question. It requires conducting a taste test with lemonades of different colors (from food coloring), and then collecting and analyzing...
Curated OER
Mystery Jars
This is a twist on the old "guess how many jellybeans" game. Using estimation and math skills, learners participate in a fun "mystery jars" activity, trying to make educated guesses at how many objects are in two jars. The basic activity...
Curated OER
Birthday Graph
For this birthday graph worksheet, students use the provided blank graph to plot information about birthday months. Students survey their classmates and record the results on the graph. Students answer 4 questions.
Curated OER
Graphs in the News
In this graphs worksheet, learners locate 2 kinds of graphs in the newspaper and answer short answer questions about them. Students complete 3 questions.
Curated OER
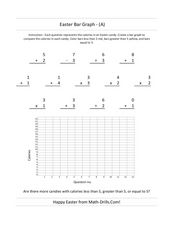
Easter Bar Graph- A
In this Easter math worksheet, students first solve 13 problems with addition, subtraction, multiplication and division. Using the answers, students make a bar graph.
Curated OER
Easter Bar Graph - (B)
In this math review worksheet, students complete addition, subtraction, multiplication, and division problems and put their answers into a bar graph that represents calories. Students complete 13 problems and 1 graph.
Curated OER
Easter Bar Graph - C
In this math review learning exercise, students complete addition, multiplication, division, and subtraction problems where each answer is inserted into a bar graph. Students complete 13 problems.
Curated OER
Easter Bar Graph - (E)
In this math review worksheet, students complete addition, multiplication, division, and subtraction problems where each answer is put into an Easter bar graph. Students complete 13 problems.
Curated OER
Easter Bar Graph - (D)
In this math review worksheet, students complete addition, multiplication, division, and subtraction problems where each answer is put into an Easter bar graph. Students complete 13 problems.
Curated OER
Halloween Graph Paper
For this Halloween-themed math worksheet, students use graph paper for math activities. Students may use this to align numbers correctly or to create graphs.
Curated OER
Color Tile Graphing
Learners explore data. They gather data and generate questions about the data in pictographs, tallies, tables, and bar graphs. Students use color tiles pulled by random to create their own bar graph. They discuss the bar graphs they...
Curated OER
Charting and Graphing Sales
Students analyze graphs, charts and tables. In this data analysis lesson, students practice creating and analyzing charts, graphs and tables corresponding to sales and surveys. This lesson uses data relevant to students and includes...
Curated OER
Use a Bar Graph
In this bar graph worksheet, students use a given bar graph to answer a set of 3 questions. Answers included on page 2.A reference web site is given for additional activities.
Curated OER
Line and Double Line Graphs: Practice
In this graphing data worksheet, students use the double line graph to answer the five questions about high and low temperatures. Students then complete two test prep questions.
Other popular searches
- Charts and Graphs Math
- Hidden Picture Math Graphs
- Misleading Graphs Math
- Powerpoint Math Graphs
- 1st Grade Math Graphs
- Math Graphs 4th Grade
- Math Reading Graphs
- Animals Math Graphs
- Math Graphs Grade 1
- Creating Math Graphs
- Math Graphs Using M&ms
- Math Interpreting Graphs


