Curated OER
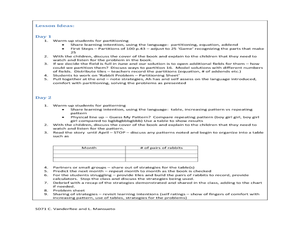
The Rabbit Problem
Students notice a number pattern in the book The Rabbit Problem by Emily Gravett. In this number pattern lesson, students represent and describe numbers appropriate to their grade level.
Curriculum Corner
Editable Exit Tickets
Here is a resource with 28 different exit ticket formats that can be used across the curriculum. Opportunities for exit assessments are endless with various prompts such as, "2 facts I learned today...
Curated OER
Tree Measurement
Students work in pairs taking measurements of a tree. They measure the trunk, crown, and height using vertical and horizontal measurement. Then students create a bar graph using the information they gathered.
Curated OER
The Average Kid
Students determine the traits they have in common with other students in the class and create visual profiles of the "average" boy and the "average" girl.
Alabama Learning Exchange
What do Plants Need?
Students plant seeds and watch them sprout. Once growing plants are placed in different conditions and students record data about their growth. They graph the data.
Curated OER
Hopes and Dreams: A Spreadsheet Lesson Using Excel
Fourth graders read "The Far Away Drawer" by Harriet Diller and discuss the story as a class. After discussion, 4th graders create a t-shirt GLYPH about their hopes and dreams,share their information with the class and create spreadsheets.
Curated OER
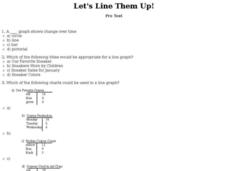
Let's Line Them Up!
In this line graph worksheet, students read through the problems about graphing and line graphs. Students select the best answer to solve the 10 online questions.
Curated OER
Be Sharp and Never Flat
An outstanding lesson on music awaits your young composers! They learn about patterns found in music, the different sections of an orchestra, and see the differences between musicians and a composer. Excellent streamed videos and good...
National Security Agency
Growing Patterns: Practical Pattern Problems
Your learners explore growing patterns by describing, extending, creating, and evaluating practical pattern problems in this three-day collaborative unit. Beginning with concrete patterns and function tables to extend and...
Curated OER
Basic Excel
Learners explore basic Excel spreadsheets. In this spreadsheet lesson plan, students enter Alaska weather information and perform calculations. Learners title the columns on the spreadsheet and format the cells. ...
Curated OER
Living in the Desert
Conduct an investigation on the plants used by the Hohokam tribe. To survive in the harsh desert environment the Hohokam used many natural resources. Learners read, research, map, and graph multiple aspects of Hohokam plant use as a...
PLS 3rd Learning
Interpreting Heart Rates During Various Physical Activities
Learners review terminology: pulse, heart rate, target heart rate zone. They work in three groups, and assigned to one of three activity stations. At 5-minute intervals, 4th graders check their pulse and record it on their group...
Curated OER
Metrically Me!
Students define the parts of a database, search strategies to locate information electronically, create/modify databases, etc. and enter data into a prepared spreadsheet to perform calculations.
Curated OER
How Does Your Blue Bonnet Grow?
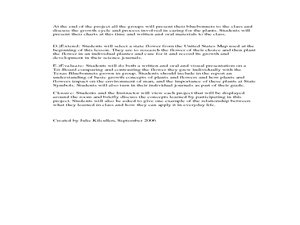
Students explore the conditions needed to grow Texas Blue Bonnets. In this Blue Bonnet planting activity, students recognize the differences in Texas Blue Bonnet. Students record their findings in a graphs and analyze their results.
Curated OER
Tracking the Salt Front
Using the Hudson River as the focus, learners discuss the difference between salt water and fresh water environments, analyze maps and graphs, and complete addition and subtraction problems. This lesson comes with a wealth of...
Curated OER
Bar Me In
Fourth graders watch a video about constructing bar graphs. They create their own graph and interpret it.
Curated OER
Fine Arts in School
In this math chart activity, students use the chart to answer the questions. The information on the chart is about students who participate in fine arts.
Curated OER
Growing Up With A Mission
Student measure heights and graph them using growth charts for which they find the mean, mode, and median of the data set. They graph points on a Cartesian coordinate system.
Curated OER
Manatee Awareness Survey
Students examine the public's awareness of manatees by taking a survey. They display the results of the survey as a graph.
Curated OER
Opening the Case
Students participate in a class survey and then design an experiment and use graphs and statistics to assist them in solving a problem. They organize the results of the survey in a stem-and-leaf plot and find the range, median, mean, and...
Curated OER
The Winner Is...
Students create graph from previously collected data using "The Graph Club."
Curated OER
Perfectly Square
Fourth graders use graph paper to make models of perfect squares. They be given a word problem in a worksheet imbedded in this plan. They may work in small groups or work alone to figure out the answer.
Curated OER
Probability
Fourth graders perform probability experiments. In this math lesson, 4th graders complete a penny toss to evaluate and graph the combinations of outcomes. In a second activity, students draw M&Ms out of a bag and graph results. In a...
Curated OER
Map Making/Floor Plans/Map Reading
Students apply their knowledge of scale when mapping the classroom. They determine the use of a map legend and orient a map using a compass. They create the classroom maps using transfer graph paper.


