Curated OER
Leaf Weight-Loss Plan
Pupils measure the weight of a container of leaves daily to discover how quickly it grows lighter as the foliage dries.
Curated OER
Patterns Everywhere!
Learners recognize and demonstrate the patterning of numbers and objects in our environment. They create a pattern using geometric shapes and find a missing number in a sequence.
Curated OER
Surname Survey
Students use data from the U.S. Census Bureau to determine whether last names in a local phone directory reflect the Census Bureau's list of the most common surnames in the country. In this surnames lesson plan, students use the Internet...
Curated OER
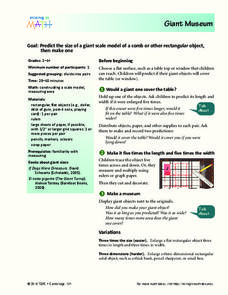
Giant Museum
Scholars make a giant scale model of an object. They will take a regular item and enlarge it to five times its length and width. They attempt this same concepts with a 3D model.
Curated OER
A Look At Rocks
Students write letters to organizations, such as United States Geological Society, to find out more about rocks. Students write about a pretend time they found a magic pebble. Students calculate distances to travel to see various...
Learn NC
Peanut Butter and Jelly and Order of Operations
Study order of operations using a peanut butter and jelly sandwich activity as your guide. The class watches you make a peanut butter and jelly sandwich based on a volunteer's instructions. They discuss the importance of following...
Illustrative Mathematics
Cynthia's Perfect Punch
Using a real-world example, this problem illustrates the thought process that learners need to engage in to understand adding mixed numbers with common denominators. First by looking at estimation, and then by drawing models that...
Curated OER
Pattern Block Activities
Students practice various math skills by using manipulative activities. In this math manipulative lesson, students sort shapes, build hexagons, and build shapes using manipulatives. These activities would be great for parent ed or...
Curated OER
Checking County Numbers
Students use their county's information page to gather information about their community. Using the information, they create graphs from the tables provided and interpret the data. They write a paragraph showing their interpretation of...
Curated OER
Locating the Salt Front
Students use Hudson River salinity data to create a line
graph that shows the location of the salt front, and use math
skills to explore how this location varies over time. They use the graph to estimate the location of the salt front...
Curated OER
Parts of a Whole
Fourth graders explore fractions through the analysis of various paintings. They view and discuss paintings by Picasso and Seurat, discuss the fractional examples in the paintings, and create a bar graph.
Curated OER
How Much Water Do We Use In Our Homes?
Young scholars discover the amount of water used for everyday activities around their home in this instructional activity. They research the amount of water needed by accessing a provided internet link. They then graph the information...
Curated OER
Mapping an Artifact
Young scholars copy a present day artifact onto graph paper. In groups, they decide the scale of the drawing and create the picture using specific graphing points. They are also given photographs in which there are no graphing points and...
Curated OER
Every Tree For Itself
Fourth graders play a game where they are trees gathering sun, water, and nutrients and CO2 represented by pieces of paper or poker chips. They record their collected requirements and graph how they grew as a forest.
Curated OER
Sink or Float?
Students predict and explore to discover which objects sink or float in fresh and salt water, predict how salt affect objects, write predictions on T chart, discuss difference between man-made and natural waters, and graph results.
Curated OER
Highs and Lows
Students use email to chart weather patterns and then graph their findings. For this weather patterns lesson, students chart their weather for a week at the school. Students then use email to find temperatures at a variety of locations....
Curated OER
The Great Turkey Walk
Young scholars formulate questions that can be addressed with data and collect, organize, and display relevant data to answer them. They wcreate bar graphs and pie graphs
Curated OER
Time, Tide, and Quahogs
Students read tide tables for Waquoit Bay as the simulate determining the best time to go clam digging for a Wampanoag clambake. They graph the tide tables while realizing that the tides a Waquoit Bay are one hour later than those at...
Curated OER
PASS the Arts
Learners explore math and art concepts, create digital art examples of the concepts, and incorporate these works into a PowerPoint portfolio with explanation and analysis.
Curated OER
Let it Grow, Let it Grow, Let it Grow
Young scholars investigate, through a hands-on activity, in which type of soil a bean seed grows best. They create a bar graph representing each plant's growth in different soils.
Curated OER
Mean, Median, Mode, and Range: Practice
In this line plots worksheet, students make a line plot for each set of data and identify any clusters or gaps. Students then find the mean, median, mode, and range for the first four problems. Students then find n using the given mean,...
Curated OER
Buoyant Force
Students illustrate Archimedes' Principle of Buoyant Force. In this graphing activity, students will observe that the buoyant force on an object is equal to the weight of the fluid it displaces. Students will then create a graph showing...
Curated OER
Asian Americans: Where Do They Come From?
Students identify 15 places (14 countries plus Hawaii) from which large populations of Asian Americans originate. They create a graph to help themselves visualize the places from which large populations of Asian Americans originate. Then...
Curated OER
Save Our Soil
Students gain an understanding of the small amount of soil available to sustain humans on earth and complete an appropriate graph or chart from their collected data. They locate some of the countries they have heard about where people do...


