Curated OER
Story Problem Writing
Students write story problems which can only be solved with the application of multiplication facts. They write an extra fact that isn't needed to solve. When their partners do the problems, they must cross out the fact that they do need.
Curated OER
Circle the Earth - Explore Surface Types on a Journey around Earth
Students use CERES percent coverage surface data with a world map in locating landmasses and bodies of water at Earth's Equator.
Curated OER
TE Lesson: Caught in the Net
Students student the concept of bycatch, the act of unintentionally catching certain living creatures using fishing equipment. They determine the difference between bycatch and target creatures. They discover what species become bycatch...
Curated OER
Peekikng At Public Sculpture
Young scholars use the internet to investigate public examples of sculpture. They reflect upon the possibility of being a reference of lifestyles that can exist in a society. A variety of media sources serve as inspiration for the lesson.
Curated OER
Making Sense of the Census
In this unit of lessons, students make sense of the Census. They examine why a census is taken and participate in activities.
Curated OER
Kincaid Creatures
Students brainstorm a list of nocturnal and diurnal wild animals they see in their community and discuss how the animals would be different if they were living during the Ice Age. Using a handout, they discover how archeologists record...
Curated OER
Design Weather Instruments using LEGO Sensors
Students design and create a LEGO structure that will house and protect a temperature sensor. They leave the structure in a safe spot and check the temperature regularly and chart it. After the students have built their structures, the...
Curated OER
VAcations in Northern California
Students explore the natural resources and National Parks of Northern California that are commonly visited by people traveling in the United States. They use maps to locate various sites, plan a highway travel route and use the internet...
Curated OER
CREATE A FISH
Students watch a video that helps shows them how a diagram, flow chart, or blueprint can help them create a 3-d fish with the correct anatomy to live in a realistic environment.
Curated OER
Hoosier Artists
Students examine the paintings of various Indiana artists. Using the internet, they relate the landscapes shown to the history of the state and how it affected Native Americans. Using the information they gathered, they write story...
Other
Ohio Department of Education: Fifth Grade Achievement Test (Practice Test) [Pdf]
Half-length practice test for the third grade OAT (Ohio Achievement Test). The test includes 17 multiple-choice and 3 open-response question dealing with topics such as measurement (unit conversion, time), geometry (volume, area), data...
Khan Academy
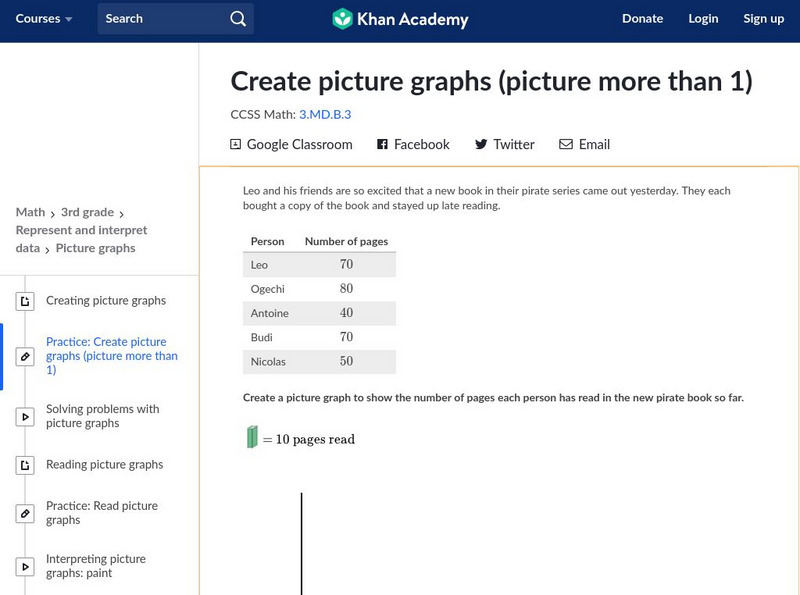
Khan Academy: Create Picture Graphs (Picture More Than 1)
Create and interpret picture graphs. Students receive immediate feedback and have the opportunity to try questions repeatedly, watch a video tutorial, or receive hints about how to create picture graphs. CCSS.Math.Content.3.MD.B.3 Draw a...
Khan Academy
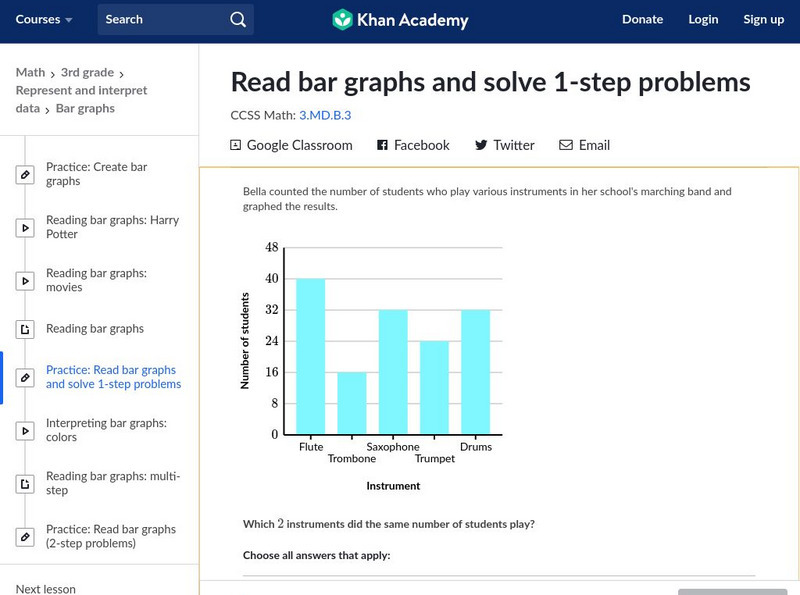
Khan Academy: Read Bar Graphs and Solve 1 Step Problems
Interpret bar graphs to answer questions about a context. Students receive immediate feedback and have the opportunity to try questions repeatedly, watch a video or receive hints.
Khan Academy
Khan Academy: Coordinate Plane Word Problems (Quadrant 1 Challenging)
Find the distance between points, graph points, and interpret data on coordinate planes to solve word problems. Students receive immediate feedback and have the opportunity to try questions repeatedly, watch a video or receive hints.
Khan Academy
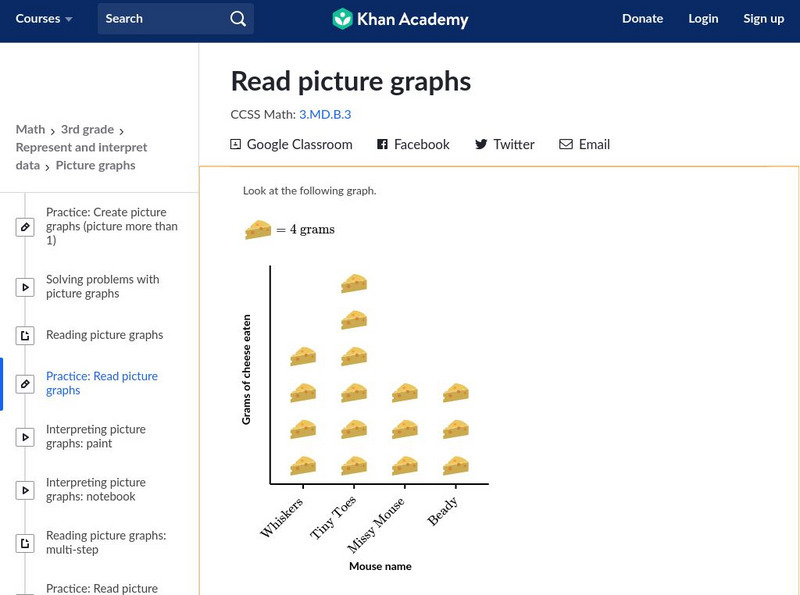
Khan Academy: Read Picture Graphs
Use picture graphs to solve word problems. Students receive immediate feedback and have the opportunity to try questions repeatedly, watch a video or receive hints. CCSS.Math.Content.3.MD.B.3 Draw a scaled picture graph and a scaled bar...
Khan Academy
Khan Academy: Read Line Plots (Data With Fractions)
Practice reading and interpreting data that is graphed on line plots. The data graphed includes fractions. Students receive immediate feedback and have the opportunity to try questions repeatedly, watch a video or receive hints....





![Ohio Department of Education: Fifth Grade Achievement Test (Practice Test) [Pdf] Study Guide Ohio Department of Education: Fifth Grade Achievement Test (Practice Test) [Pdf] Study Guide](https://d15y2dacu3jp90.cloudfront.net/images/attachment_defaults/resource/large/FPO-knovation.png)
