Curated OER
Graph Activity
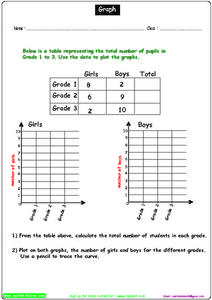
In this graphing worksheet, students complete a data table, then use the data to draw a set of 2 graphs, calculate totals and plot numbers on both graphs.
Curated OER
Immigration Graphs
Fourth graders study immigration. For this graphing lesson, 4th graders make a population graph of people who have immigrated to Indiana.
Curated OER
End of the Year Math Terms
In this end of the year math test learning exercise, 4th graders complete problems including addition, division, measurement, decimals, and more. Students complete 22 problems.
Curated OER
The Candy Color Caper
Young scholars explore the concept of probability. They calculate the probability of an event happening and graph their results. Students determine the probability of winning a sweepstakes. They construct a bar graph to represent all the...
Curated OER
Popping Problems!
Turn your math lesson into a carnival game with this fun, outdoor activity. After reviewing the concept your class will be practicing briefly, split your class up into teams and head outdoors. These teams work to solve math questions and...
Curated OER
The Number Line
Learners graph and order numbers using a number line. They also solve word problems using fractions and decimals and rewrite equations to solve problems correctly. Several example word problems are given.
Curated OER
Cold, Clouds, and Snowflakes
Students explore satellite data and graphing. In this weather data analysis math and science lesson, students analyze NASA satellite data to draw conclusions about geographical areas where precipitation might have happened. Students...
Curated OER
Mapping the Bone Field: An Area and Scale Exercise
Here is an excellent cross-curricular lesson. Learners relate multiplication to area by making a grid on graph paper, and then creating the same grid in real space outside in the school yard.
Curated OER
Coordinate Plane and Number Line
In this graph and number line worksheet, students answer multiple choice questions about points on a graph and points on a number line. Students answer 10 questions.
Curated OER
Location on a Grid
Locating a point on a grid is an important skill to master; use this practice sheet to give schlars some clear and useful experience. On a large, simple grid they use a coordinate system to find specific squares and color them a given...
Curated OER
Number Pairs
What's the coordinate pair? There are 16 letters located on this grid, each marked by a point. Learners record the number pair for each. All of the coordinates are whole numbers. Consider extending this in a fun way by challenging pupils...
Curated OER
Pick A Number
Elementary schoolers find out which month has the most class birthdays (mode) and which birthday represents the middle point of all the birthdays (median). They gather and organize data to find one number that fairly represents the whole...
Curated OER
Multiplying With Nine As A Factor
Elementary math minds complete various activities to memorize the multiples of nine. They watch a PowerPoint presentation and demonstrate the finger trick. Unfortunately the link to the multiplication activities does not take you...
PBS
Frame Yourself: Area and Perimeter
Elementary schoolers are arranged in pairs and view the video Math Works: Measurement: The Difference Between Perimeter and Area. They discuss any prior knowledge they have of the term perimeter and then brainstorm together what the...
Curated OER
Area, Perimeter and Rations Using Pentominoes
Learners of all ages investigate area and perimeter through pentominoes. In this geometry activity, students calculate the are and perimeter of different geometric shapes and describe the properties of similar and congruent shapes. This...
PBS
Blow the Roof Off!
Blow the minds of young scientists with this collection of inquiry-based investigations. Based on a series of eight videos, these "hands-on, minds-on" science lessons engage young learners in exploring a wide range of topics...
Curated OER
Fish Communities in the Hudson
Learning to read data tables is an important skill. Use this resource for your third, fourth, or fifth graders. Learners will will study tables of fish collection data to draw conclusions. The data is based on fish environments in the...
Curated OER
Volcano Spreadsheet and Graph
Fourth graders use data from volcanoes to organize a spreadsheet and make a graph.
Curated OER
Tulip Graphing
Students create a graph of tulip growth. In this data analysis lesson, students plant tulip bulbs and use graph paper to begin graphing data on the growth of the tulip.
Curated OER
Coordinate Graphs
Students use coordinate graphs in order to identify objects and their locations. They are shown how to plot the x and y coordinates and then are given values to be plotted during guided and independent practice. Students are assessed on...
Curated OER
Double Bar Graph Grid
In this math worksheet, students use this blank double bar graph grid as a tool for any graphing problem. There is a space for the title, labels for each axis and a spot for the key.
Curated OER
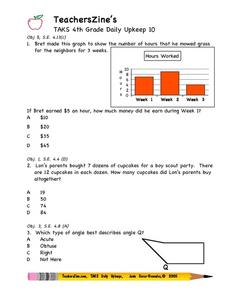
TAKS 4th Grade Daily Upkeep 10
In this math worksheet, 4th graders look for the answers to basic review problems that focus upon the skills of reading simple word problems, and applying the interpretation of data.
Curated OER
Junk Food Math
Students use Skittles candies as they explore estimation and percentages. In this math lesson plan, students sort, count, and chart Skittles candies to learn about estimation and study percentages.
Curated OER
ExplorA-Pond:4th Grade Surface Area
Fourth graders estimate the surface area of a pond using the chance method and the estimation method. They complete a graph and a short report comparing the results of the two methods.
