Curated OER
Atlatl Lessons for Grade 4
Fourth graders explore the weapons of the Aboriginal people. In this fourth grade math lesson, 4th graders create charts, tables, or diagrams to represent patterns and relations. Students investigate which dart length has the...
Curated OER
Different! Diverse! Dynamic! Lesson 1: Late Bloomers
Students examine how people grow and mature at different rates. They create a graph and a timeline to organize the data they collect.
Curated OER
Fun Creative Activities that Teach Math
Students have fun with math. In this math skills lesson, students collaborate to solve the problems presented in this interactive lesson. The problems pertain to geometry, measurement, probability, number sense, and algebra.
Curated OER
Computation: How can we use rice to solve problem questions?
Fourth graders graph metric tons of rice produced by various countries. In this graphing instructional activity, 4th graders follow problem solving steps to answer questions about rice nutrition and then graph the amount of rice...
Curated OER
Jelly Bean Math
Young scholars estimate, measure, compute, and create patterns using jelly beans. In small groups, they solve various calculations, place jelly beans into groups, invent a new flavor, create a pattern, and complete a worksheet.
Curated OER
Probability Using M&M's
Students estimate and then count the number of each color of M&M's in their bag. In this mathematics lesson, students find the experimental probability of selecting each color from the bag. Students create pictographs and bar graphs...
Curated OER
M&M Graphing and Probability
Students create a variety of graphs. They count, sort, and classify M&M's by color and record data on a chart. They use data from the chart to create pictographs, bar graphs and circle graphs. They analyze data and determine...
Curated OER
TIMS, The Bouncing Ball: Math, Science, Measurement, Graphs, Variables
Learners determine the exact relationship between the height from which a ball is dropped and the distance that it rebounds.
Curated OER
Introduction to Bar Graphs Lesson Plan
Students organize and interpret data using bar graphs.
Curated OER
Usage and Interpretation of Graphs
Students review graphing and use processing skills to solve problems.
Curated OER
Balloon Graphing
Fourth graders explore data, charts and graphs. They create graphs using titles, labels, axes, intervals, and scale correctly. Students enter their data into Excel and create a graph.
Curated OER
Environmental Graphing
Pupils experiment with graphing. In this graphing introduction lesson, students complete four activities: 1) a bar graph based on class birthdays 2) an estimation graph of the raisins in raisin bread 3) another estimation example with...
Curated OER
One Size Fits All?
Young scholars describe the differences between an estimate and a guess. They create reasonable estimates based on comparison and activities. Students explain how estimation is helpful in showing the relative size on a scale. They...
Curated OER
Mean, Median, Mode, etc.
Explore the concept of mean, median, and mode with pupils. They estimate the length of a string or the number of M&M's in a jar. Then find the mean, median, and mode of the class' estimates.
Alabama Learning Exchange
How Old is Your Money?
Elementary learners explore coin mint dates. First, they listen to the book Alexander Who Used to be Rich Last Sunday by Judith Viorst. They then sort a collection of coins according to their mint date and put them in order from oldest...
Curated OER
Location on a Grid
Make coordinate pairs more engaging by having beginners color-code a grid based on given locations. The grid has numbers along the y-axis and letters along the x-axis, introducing them to the ordering of coordinate pairs with the x-axis...
Civil War Trust
Map the Civil War
Mapmaking was a very important element in successfully planning attacks on enemies during the Civil War. Guide pupils through the process of pacing to find the average length of their steps, measure the distance between one object...
Curated OER
Measuring Mixed Numbers
Mixed numbers can be added conceptually, algorithmically, and physically. Have the class visualize mixed numbers by adding fraction bars together. They then discover the algorithmic process that simplifies adding mixed numbers. Finally,...
K12 Reader
Geometric Shape Names
Combine math and language arts in the same lesson with a reading passage about number prefixes in geometric shapes. After reading several short paragraphs about the different prefixes used in shape names, kids answer five comprehension...
Curated OER
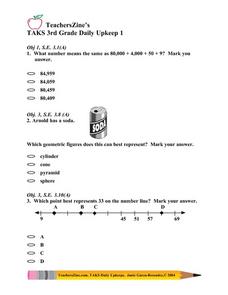
TAKS 3rd Grade Daily Upkeep 1
In this TAKS worksheet, 4th graders answer three multiple choice questions that pertain to objectives covered on the Texas state test. Students answer quesetions regarding geometric figures andplotting on a numberline.
Curated OER
Does Sunlight Effect Leaf Size?
Students make estimates and then measure leaves for accuracy. They calculate the area of the leaves by drawing an outline on graph paper and counting the squares. They compare the leaves exposed to sunlight to those that are in constant...
Curated OER
Geometric Figures-Triangles
Fourth graders explore triangles. In this math lesson, 4th graders discuss the different types of triangles. Students create triangles using wiki sticks. Students complete an online matching game.
Curated OER
Using Negative Numbers
Fourth graders explore negative numbers with this resource. They discuss positive and negative numbers by counting who is present and absent, placing numbers on a number line, and graphing temperatures. Using a variety of activities,...
Curated OER
Ready for Roots
Fourth graders sort seeds and predict what conditions are needed for them to germinate. They keep the seeds moist, observe and measure their growth and graph the results. As the seeds start to grow students compare and contrast the each...


