Curated OER
Graphosaurus
Learners complete bar graphing activities with a dinosaur theme. Students discuss their favorite dinosaurs, collect data about the discussion, and make a floor graph of the information. Learners complete a dinosaur graph worksheet.
Curated OER
Monthly Cost of Living - Food
Students determine how much they would need to feed a family for a month. They plan meals and use Internet grocery stores to find the cost of individual food items. They brainstorm in small groups to come up with 1 weeks worth of menus.
Curated OER
You Are Here
Students map local places and learn to use scale and distance. In this mapping lesson, students map their school and a favorite place. Students recreate their maps showing distance and scale sizes. Students locate their...
Curated OER
All in the Family
Students use data to make a tally chart and a line plot. They find the maximum, minimum, range, median, and mode of the data. Following the video portion of the lesson, students will visit a Web site to test their data collection skills...
Curated OER
WebQuest: Thrills and Spills- Pick Your Park!
Students participate in a WebQuest in which they must determine which amusement park is the "median priced" park. Students visit park websites to accumulate prices for parking, activities, restaurants, and gift shops.
Curated OER
I Will Meet You In The Middle
Students use the 50 States Quarter Reversal as a context of learning a curriculum concept based from the state of Utah. They research the concepts of cause and effect. Also, they use customary units of measurement to find length and...
Curated OER
Boomerang
Students explore the concept of boomerangs. In this boomerang lesson, students throw homemade boomerangs at different angles to record maximum distance and if it returned or not. Students collect their boomerang data then create a...
Curated OER
Integrated Social Studies and Math Lesson
Fourth graders study the American Civil War. They read and analyze information regarding the casualties of the Civil War, fucusing on Indiana soldiers. They graph the information and then write in their reflective journals responding...
Curated OER
Graphing Heart Rates
Students explore heart rates. They record pulse rates, predict which exercises cause a faster heart rate, make a chart, and graph the results. Students write an essay using the data to support their predictions. They write a hypothesis...
Curated OER
One Square Foot
Students identify, describe, count, tally, and graph life found in one square foot of land.
Curated OER
Math and Cinderella
Students trace their feet and them compare the different sizes of classmates. They construct a bar graph showing the results of their classmates' feet size. They discuss what kinds of conclusions can be drawn from their observations.
Curated OER
Daily Upkeep 1
In this math review worksheet, 4th graders read a graph and identify the amount of money earned during a specific week. Then they solve a word problem using multiplication or addition. Finally, students identify which angle shown is best...
Curated OER
Math: Collecting and Analyzing Date
Children count how many of an activity they can do in a row, such as ball tossing and record the date and count. Children track over a period of time and graph results.
Curated OER
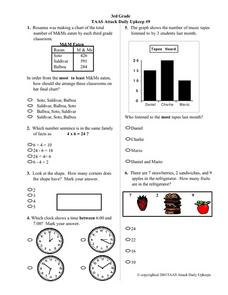
3rd Grade TAAS Attack Daily Upkeep #9
In this math literacy worksheet, 4th graders practice interpreting the pictographs in order to assemble the information to find the solutions to the 13 problems.
Curated OER
Data Analysis, Probability, and Discrete Mathematics
Fourth graders analyze the data in a bar graph, pictograph, line graph, and a chart/table and draw conclusions based on the data. They discuss each type of graph, write questions for each graph, and analyze the data as a class.
Curated OER
Popcorn Geography
Students use kernels to create a "Top Corn-Producing States" map or graph. They read and round off numbers. Students identify on a U.S. outline map the location of corn-growing states. They create a visual (map or graph) illustration...
Alabama Learning Exchange
Poppin' For Popcorn!
Students graph data from different popcorn flavors. In this graphing lesson, students make graphs using an assigned web site after collecting data about the flavors of popcorn that fellow classmates prefer.
Curated OER
Jelly Bean's Galore
Students investigate the origins of the Jelly Bean. They complete a Scavenger Hunt using the jellybean website. Pupils create a bar graph using information collected about jelly beans. Students discuss the time of year that Jelly Beans...
Curated OER
Exploring Area and Perimeter
Two students are blindfolded and each receives a cardboard square, one with pompoms glued around the edge and one with pompoms glued all over the surface. They identify what they feel. The class discusses perimeter and area of polygons....
Curated OER
A Class Census
Students recognize that data represents specific pieces of information about real-world activities, such as the census. In this census lesson, students take a class and school-wide census and construct tally charts and bar graphs to...
Curated OER
T-Shirt Lettering
Students determine the cost of a t-shirt using a variety of mathematical operations to solve problems. Then they use a spreadsheet to calculate the cost of lettering a t-shirt and display this information in a graph.
Curated OER
Lego Robotics: Measuring Speed
Students build and program a LEGO robotic car as well as measure and graph its speed. They acquire familiarity with principles of construction, motion, design and problem solving. They compare a robot's speed over two different surfaces...
Alabama Learning Exchange
Keep It Movin'!
Learners conduct an experiment to study friction. They complete a KWL chart on friction and conduct an activity about the amount of friction on a moving object. To conclude, pupils create a table or graph of the data collected and they...
Curated OER
Apples and Apple Activities
Students investigate apples. In this reading comprehension activity, students read a book about apples then compare and contrast, make graphs, distinguish between fact and fiction and work in groups. Students work in...


