Curated OER
Thanksgiving Feast (Read the Charts)
Students practice reading charts about foods country of origin. They interpret information and answer questions related to charts. They discover how food production adds to the economy.
Curated OER
Meter Reading Using Place Value
Fourth graders watch a video about reading a gas meter and discuss what they saw in the clip. For this place value lesson, 4th graders complete a worksheet where they fill in the missing dials on the meters.
Curated OER
Interpreting Data from Birdfeeders
What kinds of birds live in your area? Read a book about birds to your learners and explore their feeding patterns. Charts and graphs are provided in this three page packet, but consider assigning the basic questions if using with young...
Curated OER
Classroom Supplies
Challenge young mathematicians to buy classroom supplies by staying within the means of a $1,000 budget. The mathematical activity provides learners with the opportunity to decide what items from the supply list would benefit a class of...
Curated OER
Digger and the Gang
Help online friends Digger and Sprat from the BBC series to solve math problems! In a series of activities, your class will use data sets to calculate measurements, averages, means, and probabilities. The class completes worksheets and...
Curated OER
Is Your Money Rolling Away?
Young scholars demonstrate how to solve word problems. They will watch the video "Math Can Take You Places" and identify three problem solving strategies.
Curated OER
The First Strawberries
Young scholars explore Cherokee legends. They read The First Strawberries by Joseph Bruchac, and then do several activities to help comprehension. They discuss the book and answer comprehension questions. In addition, they retell the...
Curated OER
Winter-time Temps
Students measure temperature and become aware the the temperature above and below the snow is different. In this winter temperature lesson, students measure temperatures to find variation based on how the snow is packed. Students...
Curated OER
Introducing Multiplication
Learners will look at repeating addition examples and view how they can be written as multiplication. They use manipulatives to complete a repeating addition lesson and show it on graph paper. They also chart what they have found and...
Worksheet Web
Using Pictographs
If one ice cream cone represents three ice cream scoops, and Bob has four ice cream cones, then how many scoops does Bob have? Learners solve these kind of questions with their new understanding of pictographs.
Blake Education
Harry Potter and the Philosopher’s Stone
The motto for Hogwarts School of Witchcraft and Wizardry warns that one should never tickle a sleeping dragon, but learners will definitely be tickled by the activities in a packet of materials designed to accompany a reading of the...
Curated OER
Great Graphing!
In these graphing worksheets, students learn to read graphs and answer questions by studying the graphs about the classroom pet, shirt colors, and breakfast food.
Curated OER
What's Your Favorite Planet?
Fourth graders, after listing the nine planets and their differences, choose one planet as their favorite. From the information acquired on each students favorite planet, they make a graph illustrating their favorites and then transform...
Curated OER
Map Making/Floor Plans/Map Reading
Students apply their knowledge of scale when mapping the classroom. They determine the use of a map legend and orient a map using a compass. They create the classroom maps using transfer graph paper.
Curated OER
Place the First Digit
In this math graphs worksheet, students use the table for the 'States with the Fewest Full-Time Firefighters' math table to find the first digit value places for the word problems.
Curated OER
Integrating Math and Science
Student understanding of math concepts improves when math is integrated with science!
Curated OER
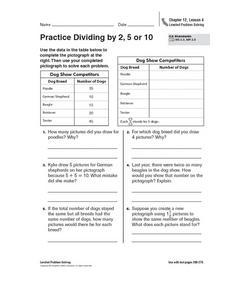
Practice Dividing by 2, 5, or 10
In this pictograph problem solving worksheet, students analyze the data on a table and create a pictograph. Students read and solve 6 story problems about the pictograph.
Curated OER
Coral Reef Center Math
In this math instructional activity, students find the solutions to the math problems with the use of the graphs using the theme of coral reefs.
Curated OER
Graphing With Paper and Computers
Fourth graders construct bar graphs. In this graphing lesson, 4th graders create bar graphs in connection with the story, The Copycat Fish. After creating the initial graphs on paper, students use MS Excel to create graphs.
Curated OER
Chances Are...
In this math worksheet, students perform 2 math investigations pertaining to probability--flipping pennies and rolling dice. Students record on the worksheet the results of each attempt, then graph the results. Note: The directions...
Curated OER
If the World Were a Village...
Your class members explore concept that the world is a large place, examine how statistics can be used to help in understanding the world and its people, and create illustrations or graphs of statistics found in the award-winning...
Curated OER
The Very Hungry Caterpillar
Read the story, The Very Hungry Caterpillar, and complete activities from multiple subjects. Make a mural, create a class graph, discuss the life cycle of a butterfly, research information about butterflies on the Internet and make...
Curated OER
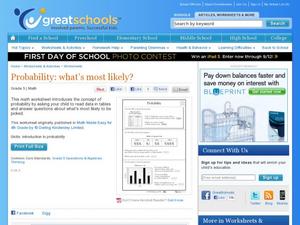
Probability: What's Most Likely?
Work with graphs, tally marks, and probability. Fifth graders read tables with different sets of data, including tally marks and a bar graph, to answer five questions. Use this worksheet as part of a probability lesson, or as a homework...
Curated OER
Does The Type of Mulch Used Affect Plant Growth?
Students measure, record and graph the plants they grow in a controlled setting. They feed and water the plants as needed and use the scientific method to evaluate the growth.


