Curated OER
Reading a Table
In this graphing activity, 4th graders focus on reading a given table. Students study a table and respond to 8 short answer questions.
Curated OER
Slanted Surveys And Statistics
Learners engage in a lesson that is concerned with the use of statistics and surveys and how they should be read. They create a survey and take it home to collect data. Then students display the data on a graph that is displayed in class.
Curated OER
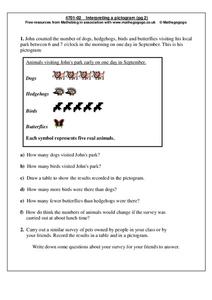
Interpreting a Pictogram
In this pictogram worksheet, learners read and analyze a pictogram about dogs, hedgehogs, birds and butterflies and then answer 6 short answer questions. Students conduct a similar survey on pets owned by their friends and put their...
Curated OER
Word Problems: "Leaving D.C."
In this solving math story problems worksheet, students read statistics from the Student edition of USA Today to solve word problems. Students solve 6 problems.
Curated OER
Using Data To Make Graphs
In this using data to make graphs worksheet, students interactively answer 10 multiple choice questions then click to check their answers.
Curated OER
Count on Math
Students develop number sense up to a million. In this developing number sense up to a million lesson, students count their breaths in given time span. Students use blocks representing 10's and 100's to create a...
Curated OER
Reading Challenge
In this math word problem worksheet, students use division to determine the page number Kelly was reading before she gave it to Andrew. Students also complete a challenge question and a graph for the reading challenge word problem.
Curated OER
Valentine Candy Count
Students analyze a bag of Valentine candy to create a graph. In this graphing lesson, students make predictions, sort by color, record data and make a graph. Students discuss results and make generalizations. Students generate their own...
Wisconsin Online Resource Center
Oversized Inch
Each member of the class creates their own paper ruler. Using their ruler, kids walk around the room measuring the objects you've specified. Discuss how items should be measured to the 16th of an inch, the smallest unit on their ruler....
Curated OER
Line Fractions
Students are read a book and discuss what is meant by different fractions. Using the internet, they practice converting fractions into decimals. In groups, they create their own line fraction after watching a demonstration by the teacher.
Curated OER
Mmm, Mmm, M&M's
Here is another version of the classic M&M math lesson. In this one, upper graders utilize the ClarisWorks Spreadsheet program in order to document the data they come up with from their bags of M&M's. After making their initial...
Curated OER
School Yard Waste
Fourth graders examine the types of garbage that they collect on the playground. They collect the information in a spreadsheet and create a graph that displays the number of types of trash found. They design and monitor a playground...
Curated OER
Using Negative Numbers
Fourth graders explore negative numbers with this resource. They discuss positive and negative numbers by counting who is present and absent, placing numbers on a number line, and graphing temperatures. Using a variety of activities,...
Curated OER
Geometric Figures-Triangles
Fourth graders explore triangles. In this math lesson, 4th graders discuss the different types of triangles. Students create triangles using wiki sticks. Students complete an online matching game.
Curated OER
Greenhouse Effect ...Building Our Own
Young scholars explore the greenhouse effect. They set up a simplified model of the earth and the greenhouse effect. Students compare temperatures inside a jar to temperatures outside the jar. Pupils collect information and create a line...
Curated OER
Place Value and Transformation
Fourth graders have a class discussion about fraction and negative numbers that were in the coordinates. They plot and read ordered numbered pairs. They transform ordered pairs and explore transformation of figures on a plane.
Curated OER
Locating IIT Using Ordered Pairs
Students investigate ordered pairs. In this math activity, students plot and locate ordered pairs in a coordinate plane and are exposed to how to read and create a map.
Curated OER
Beautiful Bovine
Looking for a fun and interactive way to explore bovine biology? Learners read a brief informational text (included for printing) before participating in several cross-curricular activities. First, grab their attention with a hilarious...
Curated OER
Factors
Practice factoring numbers by using graph paper, manipulatives and computer applets.
Curated OER
All About Me
Students use a digital camera to take pictures of various faces. They then sort pictures according to eye color and create a graph. Students draw pictures of themselves on the screen using specified tools and colors. They choose hair...
Curated OER
Range and Mode
Students interpret data from graphs. In this range and mode lesson, students review a tally chart, pictograph and bar graph. Students use these graphs to calculate the range and mode of each set of data.
Curated OER
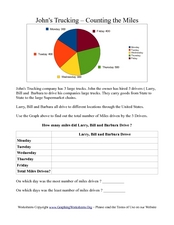
John's Trucking- Counting the Miles
In this graphs worksheet, learners analyze a pie graph showing miles driven by three truck drivers in a week. Students fill out a chart in which they calculate total miles driven.
Curated OER
Make a Tally
In this tally chart worksheet, students read the word problems and use the information within the problem to make a tally chart. Students use the tally charts to help them finish and solve the word problem.
Curated OER
Too Many Tulips
In this graphing information worksheet, students read 6 sentences and then fill in the chart with the appropriate information from the sentences.

