American Statistical Association
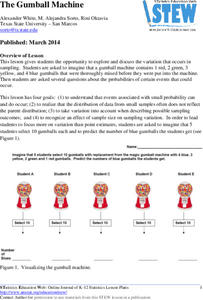
The Gumball Machine
Chew on an activity for probability. Given information on the number of gumballs in a gumball machine, scholars consider how likely it is to randomly draw a blue gumball and how many of each color they would draw in 10 trials if the...
Curated OER
Marble Mania
Students explore the concept of probability. In this probability lesson plan, students develop an understanding of probability by pulling marbles out of a bag and recording the data. Students use the recording sheet to discuss the...
Curated OER
Chances Are...
Students examine the probability of an event. In this probability lesson, students determine whether it is likely that an event will occur in coin flipping activities. They work with two and four coins, and one die in three different...
Curated OER
EMS Lesson 2: Outrageous Offspring
Young scholars investigate the principles of probability that can be used to predict hereditary traits.
Curated OER
Algebra/Geometry Institute 2007
Fifth graders practice calculating probability using statistics. In this math statistics lesson, 5th graders discover the meanings of the terms unlikely, likely, eventually, and chance, when asked to answer questions about the...
Curated OER
Statistics and Shopping
Explore how statistics are used in everyday life. Your soon-to-be savvy consumers use the Internet to find consumer-related statistical information and learn to make wise consumer decisions. Includes links to a practice sheet about data...
Curated OER
Shake, Rattle, and Roll - A Bean Game
Students (organized in partners) analyse a game through probability to decide whether it is a fair game or not.
Curated OER
Probability of a Boy
Learners investigate the concept of even change by participating in a coin flip activity. They research using the Internet to investigate the chance of giving birth to a boy.
Curated OER
Guess the Card -Probability
This site is used for distance education purposes and professional development of teachers
Curated OER
Probable Pizza Shop
Students explore possible outcomes. In this math lesson, students list the possible pizza combinations they could offer on the menu of their new pizza shop. Students
Curated OER
Assessing and Investigating Population Data
Students examine population projections. In this population data lesson, students research and collect data on the population of the United States. They explore and conclude future population growth patterns. Students construct tables...
Curated OER
Ratio and Probability
Fifth graders investigate the mathematical concepts of ratio and probability using created spinners and data collection techniques in this Math lesson for the fifth grade classroom. This lesson can be accomplished as an individual or...
Education World
High, Low, or In Between?
Trios play a card game that reinforces the concepts of number sequence and greater than and less than. Scholars make predictions based on information they know and a single unknown. They see cards drawn by others in the group, but not...
Curated OER
Word Power
Fifth graders identify a set of data from a real world problem. In this statistics lesson, 5th graders identify the range, mode, median and mean using some manipulatives. They write words randomizing the letters.
Curated OER
How Much Do I Watch TV?
In this television watching worksheet, young scholars determine the amount of television they watch in a week by recording the names and times of the shows. They total the number of hours of watching time. You can use this with upper...
Curated OER
Predicting the Future
Students examine how scientists predict the effects of global climate change. In this environmental science lesson, students participate in a discussion about using computer generated data to create climate predictions. Students examine...
American Statistical Association
Spinners at the School Carnival (Equal Sections)
Spin to win a toy car. A fun activity has pupils use a spinner in which three of the equal sections represent winning a toy car, and the fourth section represents no car. They record the number of wins after certain numbers of spins,...
American Statistical Association
Spinners at the School Carnival (Unequal Sections)
Everyone's a winner. Scholars analyze a spinner with five unequal sections, three of which represent winning a toy car and the other two represent winning a toy truck. They conduct an experiment to estimate the number of toy cars and...
Curated OER
Pizza, Pizza
Students survey community members to determine their favorite pizza toppings and create a bar graph to show their findings. In this probability and statistics lesson, students collect data by conducting a survey. They analyze the data,...
Curated OER
The Car Pool is Coming
Students evaluate the number of people who travel out of their town to work. They figure out what the percentage of each town's commuting workers is to the number who commute in the region. They plot the percentages on a pie chart.
Curated OER
Cyber Chow Combos
Students, after watching the CYBERCHASE episode, "A Day at the Spa,"represent and count combinations of choices using tree diagrams.
Curated OER
Form an Opinion-Cats
Students discuss which animal makes a better pet. In this statistics lesson, students examine the factors that cause people to choose one animal over the other (cat or dog). Students discuss their own opinions, and then view a video...
Alabama Learning Exchange
Ice Cream Sundae Survey
Young scholars analyze data through graphs. They will complete a class survey on ice cream sundaes and tally and graph the responses. They then analyze the information from the class graph.
Other popular searches
- Experimental Probability
- Probability Games With Dice
- Probability Games
- Theoretical Probability
- Probability Sample Space
- Math Probability
- Compound Probability
- Probability and Statistics
- Genetics Probability
- Conditional Probability
- Probability Lesson Plans
- Simple Probability


