Curated OER
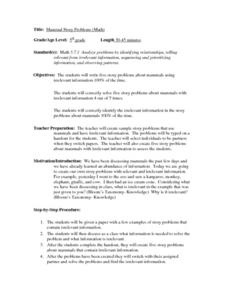
Mammal Story Problems (Math)
Fifth graders, after discussing the teacher's handout examples, practice writing five story problems about mammals using relevant/irrelevant information. As a class, they solve the story problems while identifying the key concepts that...
Curated OER
What's on Sale?
Students explore sale items. In this money and percent math lesson, students work in groups to locate food ads in the newspaper. Students identify sales and calculate final prices using percentage discounts. Students complete a math...
Curated OER
Our Town Store
Students purchase items in their classroom store. In this money activity students create a classroom store. The students have a given amount of money and have to decide if they have enough to purchase the items that they would like to.
Curated OER
Calculating Sales Tax
Observe and demonstrate how to calculate state sales taxes. Learners create a sales tax chart by calculating the sales tax amount and tax inclusive retail price for school store items, then calculate the subtotals, sales tax amounts, and...
Curated OER
Estimating Prices
Students practice making reasonable estimates. In this consumer math, students round purchase prices of items to estimate the total cost. Students practice using metal computations to arrive at estimates.
Curated OER
Exploration of "Pillbugs"
Fifth graders define vocabulary terms, identify the characteristics of a pillbug, and create a dichotomous key. Then they examine the pillbugs and make observations and record these observations. Finally, 5th graders observe specific...
Curated OER
Lesson 3: Measuring Angles
Students use a protractor to measure angles. They classify angles by type: right angle, acute angles, and obtuse angles. Students build and draw right, acute, and obtuse angles. They discuss how do people in various professions use...
Curated OER
Egyptian Hireroglyphs
Fifth graders identify the aspects of Ancient Egyptians and Heiroglyphs. They compare and contrast Egyptian Hieroglyphs with the decimal number system. Students recognize the decimal number system and compares to bases other than ten.
Curated OER
Making Change
Students investigate how to make change when purchasing items. In this making change lesson, students examine a scenario to calculate the correct change. Students play Bingo based on information and calculations to determine the amount...
Curated OER
Estimating School Store Purchases
Students examine uses for estimating, and round purchase prices to estimate total purchases in a simulated school store setting. They discuss what it means for an item to be on sale, and observe the teacher work through the process of...
Curated OER
Profit and Loss
Young scholars analyze the concept of profit and loss, the components of a simple profit and loss statement and the importance of a profit and loss statement. They calculate profits using gross income, total expenses and cost of goods...
Curated OER
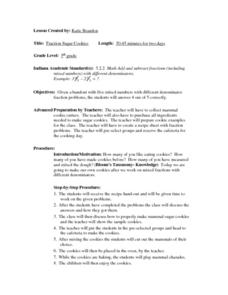
Fraction Sugar Cookies
Fifth graders practice addition, subtraction,and conversion of fractions by making cookies from a recipe. Students convert mixed number into compound fractions and combine fractions using addition in order to make a certain amount of...
Curated OER
Charting and Graphing Sales
Students analyze graphs, charts and tables. In this data analysis lesson, students practice creating and analyzing charts, graphs and tables corresponding to sales and surveys. This lesson uses data relevant to students and includes...
Curated OER
Charting and Graphing Sales
Pupils analyze and represent weekly sales figures using tables, bar graphs, and pie charts. They draw conclusions using bar graphs and pie charts. Students are told that each day at school they have the option of buying or bringing a...
Other popular searches
- Using Blooms Taxonomy Math
- Blooms Taxonomy Math Median
- Using Blooms Taxonomy in Math
- Bloom's Taxonomy Math Quilt
- Bloom's Taxonomy Math Lesson


