Curated OER
How Far Did They Go?
Students create a map. In this direction and distance lesson, students come up with familiar places in the community and calculate the distances from these places to the school. Students create a map that displays these places and their...
Curated OER
Plot It
Young scholars use a stem-and-leaf plot from a set of data to identify the range, median, and mode of their own math grades.
Curated OER
Getting the Point!
Learners explore the American cattle industry history. In this United States history and reading comprehension cross curriculum activity, students read an article about the history of longhorn cattle, then answer comprehension questions...
Curated OER
Excel temperature Graphs
Students gather data about the weather in Nome, Alaska. For this Nome Temperature lesson, students create an excel graph to explore the weather trends in Nome. Students will find the average weather and add a trend line to their...
Curated OER
Oklahoma's Berry Best
Ask your learners to complete activities related to Oklahoma's agriculture, berries in particular. The lesson is cross-curricular and has class members investigate an article about berries, write an acrostic poem, and discuss new...
Curated OER
Graphing and Analyzing Biome Data
Students explore biome data. In this world geography and weather data analysis instructional activity, students record data about weather conditions in North Carolina, Las Vegas, and Brazil. Students convert Fahrenheit degrees to Celsius...
Curated OER
Probability and Geometry
Students examine the relationship between probability and geometry to solve problems. In this geometry and probability lesson, students investigate the effect of changing percentages on a spinner to the probability of landing on a...
Curated OER
Explore the Ocean
Students explore the oceans from their origin. In this oceans lesson, students read and discuss excerpts from the Book of Genesis regarding the creation of the ocean. Students then clean up a mock oil spill, measure the volume and area...
Curated OER
Sea Ice Board Game
Students understand the sea ice cycle and can explain its stages. In this Sea Ice lesson, students play a game to identify types of sea ice. Students answer critical thinking questions about sea ice. Students complete a sea ice worksheet.
Curated OER
What's in Soil?
Students examine soil samples and make observations. In this soil lesson plan, students participate in experiments to determine the components (mineral matter, organic matter, water air) in the soil. Students analyze a pie graph on the...
Curated OER
How Oceans Affect Climate
Students draw conclusions about how the ocean affects temperature. In this weather lesson plan, students use the Internet to gather data to help them come to a conclusion about how the climate in a certain region is directly affected by...
Curated OER
Measurement: Finding Areas of Rectangles
Students construct the formula for the area of a rectangle.
Curated OER
A Matter of Fact
Students design their own Science experiment. For this science experiment lesson students create a hypothesis related to matter and test it. They displayed their data in a graph.
Curated OER
Relating to Metric Measurement
Students study metric measurements in the sport of track. In this metric measurement instructional activity, students watch a video clip to help them understand the different starting points for a track race. Students discuss the size of...
Curated OER
Proportions
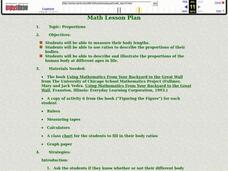
Students study proportions. In this mathematics lesson, students measure their body length, head length, and ratio of their body, write their findings on a group chart, and discuss how a person's head size or arm span are in proportion...
Curated OER
Oceans
Students complete a unit of activities to learn about ocean life as well as improve their math and measurement skills. In this ocean life and math skills lesson, students complete 8 lessons to learn about ocean life and complete...
Curated OER
Dinosaur Mathematics
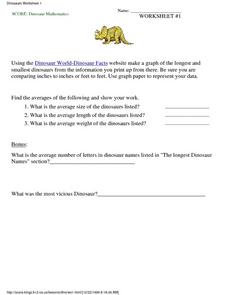
In this science and math worksheet, 5th graders answer four different questions related to dinosaurs. They graph the information with data located at a given website.
Curated OER
Gummy Bear Graphing
Students perform an experiment according to the scientific method. In this scientific method lesson, students determine how water affects the size of a gummy bear.
Curated OER
Estimate Weight In Metric
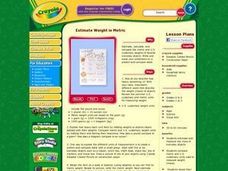
Students brainstorm words that describe the weight of objects. They pick up objects and estimate the weight. Afterward, students find the exact weight and compare U.S. units of weight to metric units. In groups, students create a chart...
Sea World
Seals, Sea Lions, and Walruses
Learn about the mammals of the sea with a lesson about seals, sea lions, and walruses. Kids study the characteristics of each pinniped with flash cards and information, and then analyze data about elephant seals, measure heat loss...
Curated OER
Cool to Rule: A Game of Prediction and Measurement
Students demonstrate measurement and estimation skills. In small groups, they are given a measurement, predict what object in the classroom is equal to that specific measurement, and record their data in a table that includes the...
Curated OER
Tree Measurement
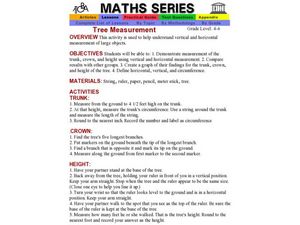
Students explore vertical and horizontal measurement of large objects. In pairs, they measure the trunk, crown, and height of a tree, create a graph of their results, and compare their results with their classmates.
Curated OER
Measure-mania
Students research the history of measurement in this lesson. They compare todays units of measurement to historical units of measurement. For example, they weigh themselves on a bathroom scale and figure out how many of them it would...
Curated OER
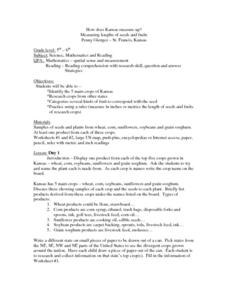
How Does Kansas Measure Up?
Students identify the five main crops of Kansas and crops that are produced in other states. The categorize the types of fruits and seeds of each plant and measure each to compare the length of each.


