Education Development Center
Making Sense of Unusual Results
Collaboration is the key for this equation-solving lesson. Learners solve a multi-step linear equation that requires using the distributive property. Within collaborative groups, scholars discuss multiple methods and troubleshoot mistakes.
Education Development Center
Choosing Samples
What makes a good sample? Your classes collaborate to answer this question through a task involving areas of rectangles. Given a set of 100 rectangles, they sample a set of five rectangles to estimate the average area of the figures. The...
EngageNY
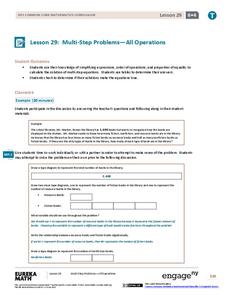
Multi-Step Problems—All Operations
Harness the power of algebra to solve problems. Young mathematicians learn to work out multi-step problems by applying algebraic techniques, such as solving equations and proportions. They use tape diagrams to model the problem to finish...
EngageNY
Summarizing a Distribution Using a Box Plot
Place the data in a box. Pupils experiment with placing dividers within a data set and discover a need for a systematic method to group the data. The 14th lesson in a series of 22 outlines the procedure for making a box plot based upon...
EngageNY
Describing the Center of a Distribution Using the Median
Find the point that splits the data. The lesson presents to scholars the definition of the median through a teacher-led discussion. The pupils use data lists and dot plots to determine the median in sets with even and odd number of data...
EngageNY
The Mean Absolute Deviation (MAD)
Is there a way to measure variability? The ninth resource in a series of 22 introduces mean absolute deviation, a measure of variability. Pupils learn how to determine the measure based upon its name, then they use the mean absolute...
Virginia Department of Education
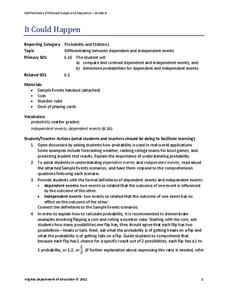
It Could Happen
Understanding of probability will probably increase with the use of a refined resource. Pupils learn to distinguish between dependent and independent events as they calculate the probabilities of these types of events in various situations.
Virginia Department of Education
May I Have Fries with That?
Not all pie graphs are about pies. The class conducts a survey on favorite fast food categories in a lesson plan on data representation. Pupils use the results to create a circle graph.
Virginia Department of Education
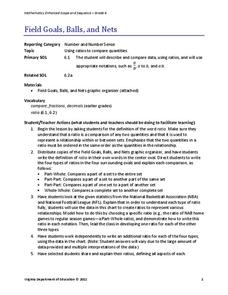
Field Goals, Balls, and Nets
Score a resource on ratios. Young mathematicians learn about different ways to express ratios. Using sports data, they write statements about the statistics in ratio form.
Virginia Department of Education
Sales Tax and Tip
Don't forget to tip your server. Future consumers learn how to calculate sales taxes and tips. Pairs use actual restaurant menus to create an order and determine the total bill, including taxes and tips.
02 x 02 Worksheets
Proportions
Cut-and-paste a great activity into your lesson plans. Scholars analyze real-world problems involving proportions. To change things up a bit they cut-and-paste quantities to create a proportion on their way to solving the problems.
EngageNY
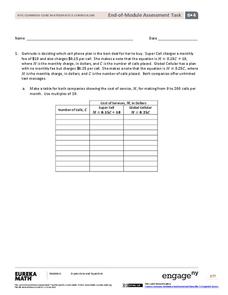
End-of-Module Assessment Task: Grade 6 Math Module 4
Finish out the module with a bang. The last installment of a 36-part module is an end-of-module assessment task. Test takers set up equations to represent relationships and solve problems in an assortment of contexts.
EngageNY
Writing and Graphing Inequalities in Real-World Problems
Inequalities: when one solution just doesn't suffice. Individuals learn to write inequalities in real-world contexts and graph solution sets on the number line. All inequalities in the lesson are of the form x < c or x < c.
EngageNY
Multi-Step Problems in the Real World
Connect graphs, equations, and tables for real-world problems. Young mathematicians analyze relationships to identify independent and dependent variables. These identifications help create tables and graphs for each situation.
EngageNY
Writing and Evaluating Expressions—Exponents
Bring your young mathematicians into the fold. Scholars conduct an activity folding paper to see the relationship between the number of folds and the number of resulting layers in the 23rd installment of a 36-part module. The results of...
EngageNY
Writing and Evaluating Expressions—Multiplication and Division
Don't table the resource on writing expressions for relationships in tables. Scholars investigate relationships between variables and write algebraic expressions involving multiplication and division. These expressions help solve...
EngageNY
Writing and Evaluating Expressions—Addition and Subtraction
Let Y represent Yes to using an excellent resource. Pupils first learn to define variables using a complete description in the 19th part in a series of 36. They write expressions involving addition and subtraction in real-world contexts...
EngageNY
Read Expressions in Which Letters Stand for Numbers III
Those key operation words sure come in handy. Groups continue their work with converting between different notations for algebraic expressions. They work in stations to write the symbolic form for given verbal phrases. This is the 17th...
EngageNY
Read Expressions in Which Letters Stand for Numbers
Pencil in the resource on writing verbal phrases into your lesson plans. The 15th installment of a 36-part module has scholars write verbal phases for algebraic expressions. They complete a set of problems to solidify this skill.
Virginia Department of Education
Scientific Notation
Writing a number is all in the notation. The resource introduces the class to scientific notation. Pupils learn the process of taking a very large or small number in standard form and write it in scientific notation. To practice,...
EngageNY
Presenting a Summary of a Statistical Project
Based upon the statistics, this is what it means. The last lesson in a series of 22 has pupils present the findings from their statistical projects. The scholars discuss the four-step process used to complete the project of their...
EngageNY
Summarizing a Data Distribution by Describing Center, Variability, and Shape
Put those numbers to work by completing a statistical study! Pupils finish the last two steps in a statistical study by summarizing data with displays and numerical summaries. Individuals use the summaries to answer the statistical...
EngageNY
Describing Center, Variability, and Shape of a Data Distribution from a Graphical Representation
What is the typical length of a yellow perch? Pupils analyze a histogram of lengths for a sample of yellow perch from the Great Lakes. They determine which measures of center and variability are best to use based upon the shape of the...
EngageNY
Comparing Data Distributions
Box in the similarities and differences. The 19th lesson in a unit of 22 presents class members with multiple box plots to compare. Learners use their understanding of five-number summaries and box plots to find similarities and...


