Curated OER
Transformations
Sixth graders discover transformations. In this graphing activity, 6th graders explore visual examples of plotting transformations as they review translations, rotations, and reflections. Students also practice solving problems that...
EngageNY
Ratios and Unit Rates
This turn-key unit on ratios and unit rates walks through a 30-lesson unit on teaching proportional reasoning, with each lesson broken into detailed teaching notes and time allotments for all parts. An unbelievable resource when taken...
Curated OER
Opening the Case
Students participate in a class survey and then design an experiment and use graphs and statistics to assist them in solving a problem. They organize the results of the survey in a stem-and-leaf plot and find the range, median, mean, and...
Virginia Department of Education
May I Have Fries with That?
Not all pie graphs are about pies. The class conducts a survey on favorite fast food categories in a lesson plan on data representation. Pupils use the results to create a circle graph.
Curated OER
In the Wake of Columbus
Students explore how the population decreased in native cultures.
Curated OER
Graph It
Elementary and middle schoolers engage in a lesson of graphing in quadrant I of the coordinate plain. They use the graph to create shapes and symbols. While using a graphing calculator, they locate the points on the coordinate plane. In...
National Security Agency
What’s Your Coordinate?
Your middle schoolers will show what they know with their bodies when they become the coordinate plane in this conceptual development unit. Starting with the characteristics of the coordinate plane, learners develop their skills by...
Alabama Learning Exchange
Investigating Friction
Young learners explore friction. They view a video or DVD (bibliography provided) and define terms related to friction, and work in groups to experiment with the effects of friction on speed and motion using ramps and toy cars.
Curated OER
Data and charts
In this data and charts worksheet, students answer multiple choice questions referring to different charts about mountain heights, breakfast drinks, and more. Students complete 10 multiple choice questions.
Curated OER
Aruba Cloud Cover Measured by Satellite
Students analyze cloud cover and to compose written conclusions to a given related scenario. They submit a letter of response and a report detailing their calculations and conclusions.
Curated OER
Integers in the Weather
Middle schoolers engage in a clever lesson that combines meteorology with mathematical thinking. They use integers in relation to high and low temperatures that they record. They use a spreadsheet of weather data, a computer, and gain...
Noyce Foundation
Snail Pace
Slow and steady wins the race? In the assessment task, scholars calculate the rates at which different snails travel in order to find the fastest snail. Hopefully, your class will move much more quickly in finishing the task!
Curated OER
Naming Points on the Coordinate Plane
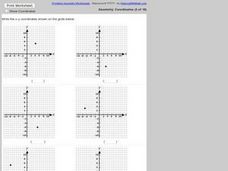
For this naming points on the coordinate plane worksheet, middle schoolers name 6 coordinates off of 6 graphs. Students name the x and y-coordinates of 6 different points in all four quadrants.
Curated OER
A Statistical Look at Jewish History
Students complete their examination over the Jewish Diaspora. Using population figures, they discover the importance of percentages in exploring trends. They use their own ethnic group and determine how it is represented in the United...
Curated OER
The Bigger they Are . . .
Students do a variety of data analyses of real-life basketball statistics from the NBA. They chart and graph rebounding, scoring, shot blocking and steals data which are gathered from the newspaper sports section.
Curated OER
Identifying Points in the Coordinate Plane
In this ordered pairs worksheet, learners identify 6 ordered pairs given a coordinate plane. Students list the ordered pair given the graph.


