Curated OER
How Oceans Affect Climate
Students draw conclusions about how the ocean affects temperature. In this weather instructional activity, students use the Internet to gather data to help them come to a conclusion about how the climate in a certain region is directly...
Curated OER
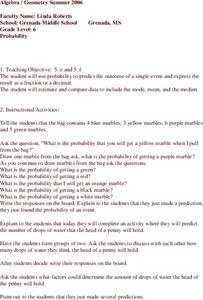
Probability
Sixth graders study the probability of single events. Given a bag of marbles, they discuss and find the probability of single events. In groups of two, 6th graders complete additional activities, predicting the probability. Students...
Curated OER
Using Averages to Create Graphs Through Excel
Sixth graders create and use a spreadsheet to make graphs which will be used to analyze Progress Report and Final Report Card grades. They practice finding the mean, median, mode, and range of a data set. Students also incorporate column...
Curated OER
Measuring "pHacts" about Acid Rain
Sixth graders gather and graph information regarding the pH of rain. Working cooperatively with an internet partner, 6th graders gather and record information about the pH of the rain in their local area. They graph this information...
Curated OER
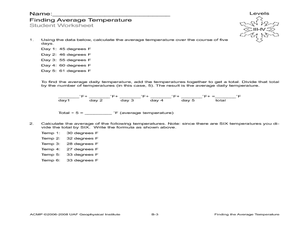
Finding the Average Temperature
Students calculate averages. In this average temperature lesson, students collect data and use their problem solving skills to calculate average temperatures.
Curated OER
The Statistics of M&Ms
Students explore the topic of statistics with M and Ms. For this math lesson plan, students use candy pieces to sort and gather information needed to create a bar graph. This lesson can be adapted to accommodate students in grades 1-12.
Curated OER
Stem-and-Leaf Plots
Students are introduced to stem-and-leaf plots and calculating the mean, median, and mode from the plots.
Curated OER
Raisin Cane
Young scholars estimate and record the number of raisins in a snack-size box. They also graph their results and note the differences (+ or -) from their estimate and actual number.
Curated OER
Opening the Case
Students participate in a class survey and then design an experiment and use graphs and statistics to assist them in solving a problem. They organize the results of the survey in a stem-and-leaf plot and find the range, median, mean, and...
Curated OER
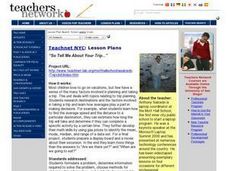
"So Tell Me About Your Trip..."
Young scholars research destinations and the factors involved in taking a trip and explore how averages play a part in making decisions. They explore how to find the average speed and the distance to a particular destination, they...
Alabama Learning Exchange
The State Capital of Stem and Leaf
Students explore the concept of stem and leaf plots. For this stem and leaf plots lesson, students plot the 50 US states' capitals on a stem and leaf plot according to the first letter of each state. Students compare their stem and...
Curated OER
Chips Ahoy A Thousand Chips In Every Bag
Sixth graders determine whether Nabico's claim to sell 1000 chocolate chips in every 1 pound bag of Chips Ahoy! is true.


