CK-12 Foundation
Line Graphs to Display Data Over Time: Strawberry Competition
Take the tediousness out of graphing. Using the interactive tool, learners can efficiently create a line graph from a set of data. They then use the graph to answer questions about specific trends in the data.
Curated OER
Exploring Area and Perimeter
Two students are blindfolded and each receives a cardboard square, one with pompoms glued around the edge and one with pompoms glued all over the surface. They identify what they feel. The class discusses perimeter and area of polygons....
Curated OER
Using Excel To Teach Probability And Graphing
Students engage in the use of technology to investigate the mathematical concepts of probability and graphing. They use the skills of predicting an outcome to come up with reasonable possibilities. Students also practice using a...
Curated OER
Fantasy Basketball
Students play Fantasy Basketball in order to practice locating Internet information and using technology tools to display data; students demonstrate an understanding and use of graphing, probability, and statistics.
Curated OER
Science of Special Effects
This is a creative, multidisciplinary, well-designed instructional activity provided by Scientific American related to special effects. Students make their own animated short films and use math and computer skills.
Curated OER
Presidential Trading Cards
Learners research the Internet to collect data about the US Presidents. They use the data that they collect along with available technology to produce trading cards and brochures using keyboarding skills, text boxes, acquiring photos,...
Curated OER
Leonardo da Vinci
Students select appropriate tools and technology to perform tests, collect data, and display data. They construct appropriate graphs from data and develop qualitative statements about the relationships between variables.
Curated OER
Paper Towel Structure
Students investigate technology and its purpose in the workplace. In this geometry instructional activity, students design and build a paper towel structure to investigate motion and forces. They are given a restricted weight and asked...
Curated OER
The North (Wall) Star
Young scholars engage in a lesson which shows them that celestial navigation is the art and science of finding one's geographic position by means of astronomical observations, particularly by measuring altitudes of celestial objects -...
Curated OER
The Robot Artist--Aaron
This is a creative multidisciplinary instructional activity which will involve young scholars in art, technology, and psychology. Students learn about Harold Cohen who created a robot programmed to create art. Young scholars will also...
Curated OER
The Human Memory
This is a well-designed, creative lesson to help students learn more about the human memory. Working in pairs, students complete tasks and gather data. Excellent websites for resources are also provided.
Curated OER
World in the Balance
Learners make estimates on how many people they believe live on Earth. While watching a video, they take notes on the issues facing Kenya, Japan and India. In groups, they calculate how long it takes for a country to double in size. To...
Curated OER
Perimeter Patterns
Sixth graders calculate perimeter of rectangles with different dimensions. In this perimeter lesson, 6th graders define length, width and perimeter. Students complete a perimeter activity using a web tool to change the...
Curated OER
Patterns, Functions, and Algebra: Wired for Space
Students assess how patterns, functions and algebra can assist NASA engineers design new ways of propelling spacecrafts. They explore how electricity and magnetism are replacing the fuel-consuming rocket propulsion. Electromagnetism is...
Curated OER
Coin Count & Classification
Students make a prediction about how 100 pennies sort by decade or year and then test their predictions. They organize their data using a graph that is imbedded in this lesson.
Curated OER
Botanical Discoveries
Sixth graders examine the Lewis and Clark Expedition. In this plant discovery lesson, 6th graders put in chronological order the plant discoveries of Lewis and Clark. Students understand the characteristics of leaves and find the area of...
Curated OER
Catapults
Students test catapults. In this physics instructional activity, student conduct scientific investigations that require them to test catapults. Students practice their problem solving skills as they employ the use of the scientific method.
Curated OER
Where Does It Come from?
Students read articles about various agricultural products and create a map using the statistics in the article. In this agricultural statistics lesson plan, students look at the geography of the country and which products come...
Curated OER
Human Fingerprints: No Two the Same
Sixth graders explore scientific observations by analyzing a group of data. In this fingerprint identification lesson, 6th graders identify the reasoning behind fingerprinting and create their own ink fingerprints. Students discuss the...
Curated OER
Mapping the Transcontinental Journey
Students develop their geography skills. In this Lewis and Clark lesson, students collaborate to calculate the time and distance of different segments of the expedition. Students compare their estimate to Lewis and Clark's.
Curated OER
Principles of Flight: Bernoulli's Lift
Students discover how air pressure effects flight. In this physics activity, students create two types of airplane wings so they can observe the way air pressure creates lift. Students utilize a printout to create the...
Curated OER
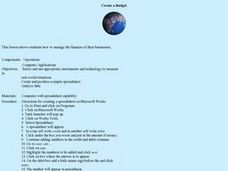
Create a Budget
Students develop a budget spreadsheet to manage finances for their business. In this finance lesson, students use a spreadsheet program to create a budget with credit and debit columns. There are step-by-step directions for...
Curated OER
Classification of Cerealites
Students create a dichotomous key. In this categorizing activity, students create a dichotomous key for different types of cereal. Students classify the cereal into groups such as flakes and cereal with holes. Students discuss their...
Curated OER
Apple Estimation: Percentages & Subjective Reasoning
Students practice using their estimation skills by utilizing apples. In this percentage lesson plan, students utilize a scale and an apple to discover the percentage of each bite they take. Students share their data with the...


