Curated OER
Questioning NASA
Space science and math collide in this inquiry that investigates launching times for antacid-tablet rockets! Upper elementary or middle school learners collect data as they launch these mini rockets. They apply concepts of place value...
Curated OER
Raisin the Statistical Roof
Use a box of raisins to help introduce the concept of data analysis. Learners collect, analyze and display their data using a variety of methods. The included worksheet takes them through a step-by-step analysis process and graphing.
Curated OER
Height versus Shoe Size
Middle schoolers find a correlation between a person's height and his/her shoe size. They have access to entering data into lists on a graphing calculator and can complete scatter plots. Students read and interpret a scatter plot and use...
Curated OER
The Dog Days of Data
Young scholars are introduced to the organization of data This lesson is designed using stem and leaf plots. After gather data, they create a visual representation of their data through the use of a stem and leaf plot. Students...
Curated OER
How Oceans Affect Climate
Learners draw conclusions about how the ocean affects temperature. In this weather instructional activity, students use the Internet to gather data to help them come to a conclusion about how the climate in a certain region is directly...
Curated OER
Breakfast Cereal - How Nutritious Is Yours?
Middle schoolers analyze the nutritional value of breakfast cereal in order to make an informed choice. They create a stem and leaf plot which analyzes the nutritional value of the cereal they eat on a regular basis. Students write a...
Curated OER
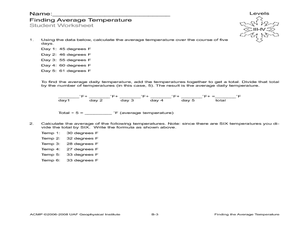
Finding the Average Temperature
Students calculate averages. In this average temperature instructional activity, students collect data and use their problem solving skills to calculate average temperatures.
Alabama Learning Exchange
The State Capital of Stem and Leaf
Students explore the concept of stem and leaf plots. In this stem and leaf plots lesson, students plot the 50 US states' capitals on a stem and leaf plot according to the first letter of each state. Students compare their stem and leaf...
Curated OER
Exquisite Excursions
Students locate 6 cities, one on each of the 6 major continents. They find distance for each leg of their journey, convert to percents, use a time zone map, and convert to foreign currencies.
Curated OER
Using Computer for Statistical Analysis
Students examine the use for spreadsheets in analyzing data. They make spreadsheets that display and calculate a given data set such as temperature change.
Curated OER
"So Tell Me About Your Trip..."
Young scholars research destinations and the factors involved in taking a trip and explore how averages play a part in making decisions. They explore how to find the average speed and the distance to a particular destination, they...
Curated OER
Student Heights
Students measure the heights of their fellow classmates and create a box and whisker plot to display the data. In this measurement lesson plan, students analyze the data and record results.
Curated OER
Dealing With Data
Students collect, organize, and display data using a bar graph, line graph, pie graph, or picture graph. They write a summary describing the data represented and compare the graph to another graph in the class.
Illustrative Mathematics
Puppy Weights
Nobody can say no to puppies, so lets use them in math! Your learners will take puppy birth weights and organize them into different graphs. They can do a variety of different graphs and detail into the problem based on your classroom...
Curated OER
What's Up With My Class
Students collect data about their class and they use Excel spreadsheet to display their tables and graphs about the class. They answer survey questions and collect their data. Students create a graph of their choice to display the...
Curated OER
Chips Ahoy A Thousand Chips In Every Bag
Sixth graders determine whether Nabico's claim to sell 1000 chocolate chips in every 1 pound bag of Chips Ahoy! is true.
Curated OER
Probability: The Study of Chance
Students practice the basic principles of probability by conducting an experiment, determining if a game is fair, collecting data, interpreting data, displaying data, conducting analysis, and stating and applying the rule for probability.
Other popular searches
- Range, Mean, Median, Mode
- Range Mean Median Mode
- Mode, Range, Mean, Median
- Range, Median, Mode, Mean


