Radford University
Peer Survey on Current Events
Stay up to date on current events as well as how the class views the issues. A performance task has scholars select a current event of interest and design a class survey on the topic. They conduct the survey, analyze, and report the...
Radford University
The Next Big Thing
Make sure the next product is a hit. An engaging task has scholars design an item to sell at a sports event and then conduct a marketing survey. They decide whether to use random sampling, stratified sampling, or cluster sampling, and...
Radford University
Survey Activity
It's time to take a survey. After looking at an example of a survey on lunch preferences, groups design their own surveys. They consider the sample size and sampling technique, then conduct the surveys. As a final activity, they create...
Radford University
Data Analysis Activity
What do classmates think? In groups, learners design surveys to investigate chosen topics. They conduct the survey, then analyze the results. As part of the activity, they must calculate the mean, median, mode, variance, and standard...
Radford University
Connecting Theoretical and Experimental Probability
Play some games, develop a law, and then call it a day. Learners first perform a small number of trials for a probability experiment, then predict the result for a larger number of trials. They then compile data from the entire class to...
Radford University
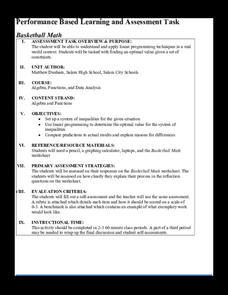
Basketball Math
Shoot for a better knowledge of optimization strategies. During the first part of the task, scholars use given basketball shooting percentages for different players to predict the winner by examining systems of inequalities. For the...
Radford University
Geyser Graphical Activity
Thar she blows! An engaging activity teaches pupils about geysers. They first read information about the Strokkur geyser in Iceland and analyze data on its eruptions by creating multiple data representations. Once finished, they research...
Radford University
Modeling Statistical Data
Can people predict the number of future divorces? Scholars research and analyze data on the number of divorces and teenage pregnancies in Virginia over time. They use the data to create graphs, determine the best-fit equations, and make...
Radford University
Curve of Best Fit
Don't watch the resource go down the drain. Scholars perform an experiment where they measure the amount of water that flows from a funnel over time. They use the data to create graphs and find the curves of best fit.
Radford University
Body Measurement Activity
Don't keep the resource at an arm's length. A hands-on activity has scholars measure the heights, arm spans, hair lengths, and foot lengths of their classmates. They create scatter plots to determine if there is a correlation between...
Radford University
Modeling the Number of Starbucks Stores
Drink your coffee, then marvel over the rise of Starbucks. Scholars use provided data on the number of Starbucks stores from 1987 through 2014 to create scatter plots. They then determine the equation for the curve that best fits the...
Radford University
Temperature Math Activity
Warm up to a vacation-finding activity. After choosing a location for a vacation, pupils research the average monthly temperatures for the locality. They create scatter plots of the data and then determine the equations of the best-fit...
Radford University
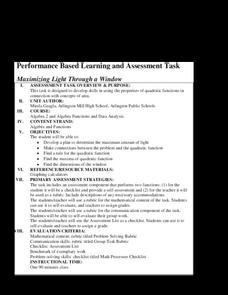
Maximizing Light Through a Window
Let there be plenty of light. For a perimeter of 10 feet, scholars determine the maximum area of a window composed of a rectangle and a semicircle. They draw diagrams and then write and solve equations to find the height and radius for...
Radford University
Connecting Scatter Plots and Correlation Coefficients Activity
Collect a variety of bivariate data. Groups determine sets of data that would provide a positive, negative, and no correlation. Team members gather their data through out the week. Scholars plot the data and determine the relationship...
Chicago Botanic Garden
Ecological Mismatches
Modeling is a powerful teaching tool. The final installment in a six-part series has pupils complete an activity to model a food web and discover the interconnected relationships in an ecosystem. They then read about changes in migratory...
Chicago Botanic Garden
Plant Phenology Data Analysis
Studying data over time can paint a pretty interesting picture. Learners use data they collected in the previous instructional activity to compare to historical data in a similar region. They graph the data of the first bloom of a...
Chicago Botanic Garden
Seasons of a Plant
Reading the cues from nature can be as much an art as a science. The second installment in a six-part unit on climate teaches learners that environmental and biological events have significance. They first learn the difference between...
George Watts Montessori
Upper Elementary Lessons for Classroom and Garden
Plant knowledge by doing to create long-lasting results. Creating a school garden gives young scholars the opportunity to study several science topics. By working through the unit of 16 lessons, pupils use their gardens to complete...
National Wildlife Federation
Watershed Web: A Field Trip
Observing plant succession doesn't have to be a decade long process. A hands-on lesson has groups study succession over a designated space. Learners use their observation skills to record differences in plant and soil characteristics in...
National Wildlife Federation
Night Friends - American Bats
Bats are a misunderstood species. Pupils learn about the characteristics of bats in a three-part lesson. They begin by examining the adaptations of different types of bats, then explore the misconceptions humans have about the species....
National Wildlife Federation
How Do You Feel About Water?
Less than one percent of the water on Earth is usable in people's homes. As pupils consider this fact, they reflect on their own water usage before designing a survey to collect information on water usage by others. They then analyze...
National Wildlife Federation
Danger from Afar: Non-Point Source Pollution and the Lake Superior Basin
How prevalent is pollution in the water system? A hands-on activity focuses on one area that is prone to pollution. Learners use game chips to represent clean water and polluted water and complete an activity that demonstrates how...
Radford University
Can I Create a Line/Curve of Best Fit to Model Water Drainage?
Learners collect data on the amount of water left in a bottle over time. They graph the data to determine whether the scatter plot shows a curved or straight relationship. Group members then determine an equation for the curve of best...
Radford University
Pizza, Pizza!
Ponder the problem of pizza prices. Pupils use provided information about two different pricing schedules for pizza. They create tables of values and functions to represent the pricing schemes, consider domain restrictions, and identify...


