101 Questions
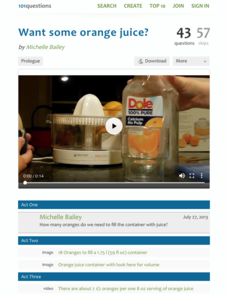
Want Some Orange Juice?
Juice up your lessons with an open-ended resource. Scholars must determine how many oranges it takes to fill a container with juice. They use information presented in a video and as images to find the solution.
101 Questions
Slow Church
The church that just can't stay put! A video presentation raises questions of just how far the church will move. Presented with the rate of movement and a range of time expected, scholars build an inequality to answer the question.
101 Questions
Nana's Lemonade
Consistency is the key. One lemon wedge per glass of water makes a nice glass of lemonade. Young scholars must identify the number of lemon wedges they need to make the same lemonade in a big gulp cup. They develop their own solution...
Concord Consortium
Center of Population
Let the resource take center stage in a lesson on population density. Scholars use provided historical data on the center of the US population to see how it shifted over time. They plot the data on a spreadsheet to look the speed of its...
Corbett Maths
Inverse Proportion
Take an indirect view of proportionality. Using a similar approach of direct variation, the resource shows how to solve inverse proportions. The video steps through finding the constant of proportionality to write the formula for the...
PBS
Math with Jake: Frequencies and Pitch
Be an octave above the rest. A musician explains how to write music in different time signatures. An interesting resource continues to demonstrate ratios using the pitch of musical notes and hertz. Pupils use a pitch table and determine...
CCSS Math Activities
Smarter Balanced Sample Items: 7th Grade Math – Target E
How well do your classes understand scale? You'll certainly know after they answer the set of eight questions from an informative and helpful presentation. Questions include items from coordinate geometry, similar triangles, and scale...
Curated OER
Reading and Making Pie Graphs
In this pie graphs worksheet, students solve 10 different problems that include reading a pie graph. First, they use the pie graph to respond to 5 questions that follow. Students determine the year that had the smallest and largest...
Curated OER
Locate Ordered Pairs
In this ordered pairs worksheet, students solve and graph 6 different graphs that include various ordered pairs. They determine each ordered pair shown in the graphs. Then, students write the letter for the point named by the ordered...
Curated OER
Can we Predict Differences?
Students differentiate between linear and non-linear graphs. In this algebra lesson plan, students investigate slopes as it relates to a function using graphs of linear and non-linear equations. They collect data using the TI to graph...
Curated OER
Taste the Rainbow
Students practice estimating and graphing by utilizing Skittles. In this statistics instructional activity, students complete worksheets based on the likelihood of a certain color of skittle coming out of the bag. Students create a...
Curated OER
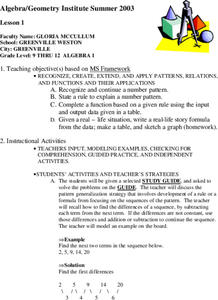
Patterns, Relations, and Functions
Students investigate the patterns of different data sets of numbers. They use critical thinking skills in order to find the missing numbers in any given set. This lesson helps to develop the skill of number sense.
Curated OER
Writing Coordinates
In this writing coordinates worksheet, learners solve and graph 6 different problems related to writing various coordinates on the graph. First, they move to the right and up on the grid, naming the point found. Then, students move up or...
Curated OER
Pictographs
In this pictographs worksheet, 7th graders solve 6 different problems related to the pictograph shown at the top of the sheet. First, they pretend that they counted birds and their numbers are represented in the pictograph. Then,...
Curated OER
Creating Frequency Tables
In this frequency table worksheet, students explore a given set of numbers. They group the data and create a frequency table. This one-page worksheet contains ten problems.
Curated OER
Plot the x-y Coordinates on the Grids Below
In this coordinate grid graphing activity, learners plot the given points onto each of 6 coordinate grids. All points are located in quadrant 1. One point is plotted on each grid. Answers are given by clicking the appropriate place on...
Curated OER
Which Bag is Which?
Students explore number sense by completing a statistical analysis game in class. In this data graphing lesson, students utilize visual references such as colored cubes and tiles to map out the results of an experiment outcome such as a...
Curated OER
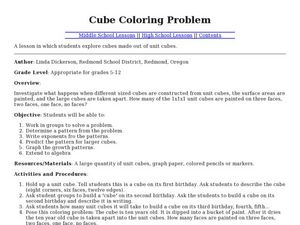
Cube Coloring Problem
Young scholars investigate what happens with different sized cubes are constructed from surface cubes. The students solve various problems by predicting patterns, determining exponents and graphing results.
Curated OER
Causal Patterns in Density Phenomena
Students investigate the relationship between volume and mass in different liquids such as vegetable oil, rubbing alcohol and water. They measure the mass of several different volumes of each liquid and then graph the results as well as...
Curated OER
Curses and Re-Curses! It's Happening Again.
Learners study basic recursion by exploring patterns in the data they generate from two simple probability-based experiments. In the first, students flip a coin to discover how many times they must flip it before it lands on "heads."...
Curated OER
Comparing Earth and Mars
Students work together to compare and contrast Mars and Earth. Using the internet, they answer questions given to them by their teacher and calculate answers showing their work. They graph their answers and discuss the results of the...
Curated OER
Candy is Dandy
Middle schoolers view the benefits of using graphs to communicate information, answer questions and solve problems. They investigate color distribution in bags of M & M's. Working with actual bags of candy, they will sort and...
Curated OER
Guess My Rule (Function Tables)
Seventh graders recognize and solve functions. To reinforce the solving of word problems, 7th graders play a guessing game where they try to identify the functions used. They complete worksheets and draw graphs to match the problem in...
Curated OER
Inequalities lesson 4
Seventh graders graph solutions for inequalities on a number line. They solve problems combining like terms inequalities in one variable. Students check solutions to combining like terms inequalities in one variable.
Other popular searches
- Charts and Graphs
- Bar Graphs
- Line Graphs
- Double Bar Graph
- Circle Graphs
- Pie Charts and Graphs
- Picture Graphs
- Coordinate Graphs
- Skittles Bar Graph
- Reading Charts and Graphs
- Blank Coordinate Graphs
- Percent Circle Graph


