Curated OER
On the Track With NASCAR
Students complete a variety of activities to research stock car racing. They use the Internet to research NASCAR acronyms, schedules, results, car design and other aspects.
Kenan Fellows
A Farmer’s Challenge to Breed to the Greatest of Grapes
What does your class know about GMOs? Are they savvy to selective breeding? Challenge young minds to engineer the greatest crop of all time using a hands-on genetics unit. Learners discover the good and bad details of selective breeding,...
Scholastic
The Flight of Amelia Earhart Teaching Guide
Amelia Earhart's accomplishments and strength of character extend beyond her status as one of the first female aviators in America. Elementary and middle schoolers learn about Earhart's early life and the historical context surrounding...
NASA
Lava Layering
Take the old baking soda and vinegar volcano to the next level by using it to study repeated lava flows over time, examine geologic features on Earth and Mars, and speculate about some of the formations on Mars.
Discovery Education
Fuss About Dust
Dust is everywhere around us; it's unavoidable. But what exactly is dust and are certain locations dustier than others? These are the questions students try to answer in an interesting scientific investigation. Working independently or...
Curated OER
He Said, She Said, So: What's the Point?
Not by the hair on my chinny chin chin! Upper graders and middle schoolers read the story The Three Little Pigs and other tales related to the story from various points of view. They use the Internet to find more stories...
Curated OER
Balancing the Scales: Understanding Ratios
Students are introduced to the concept of ratios. In groups, they convert sets of numbers into a ratio. After practicing, they use the ratios and proportions to solve story problems. They also calculate map distances and discover map...
Curated OER
Computer Repair and Recycle
Students disassemble and rebuild computers. In this computer hardware lesson plan, students learn to refurbish computers, then donate the rebuilt computers in their community.
Curated OER
What Does It Matter?
Students define matter, the chemical properties of matter, and the physical properties of matter. They name physical and chemical properties of matter (by classifying using a Tree Map). Students determine the mass, volume, and density of...
Curated OER
A Statistical Look at Jewish History
Students complete their examination over the Jewish Diaspora. Using population figures, they discover the importance of percentages in exploring trends. They use their own ethnic group and determine how it is represented in the United...
Curated OER
What's Out There? Space Shuttle Exploration and Simulation
Students role-play the jobs of space shuttle astronauts, conduct experiments, and research space using the Internet and offline experiments. Student-astronauts hold a "press conference" to share their information with others in a...
Curated OER
The Time of Man
Young scholars demonstrate visually Mankind's relative place on the earth's timeline. They familiarize themselves with the use of the metric system in measuring and producting a timeline.
Curated OER
What is for Sale and at What Price?
Seventh graders will research information on products carried by a store (such as sporting goods, department, clothing, etc.) They will create purchase prices for the products they wish to carry. They also will decide what percentage...
Curated OER
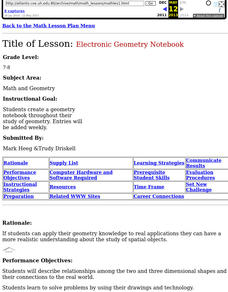
Electronic Geometry Notebook
Students examine the relationship between two and three dimensional shapes. They use their drawings to solve problems. They create a notebook of the formulas and how they relate to the real world.
Curated OER
Quilt Squares
Students research the history of the quilt in American History and view a PowerPoint Presentation. They create a quilt square with colored paper using polygons, transformations, rotations, and reflections on the computer and on a...
Curated OER
Simple Bar Graphs Using Excel
Young scholars create original survey questions, and develop a bar graph of the data on paper. They input the survey data using two variables onto an Excel bar graph spreadsheet.
Curated OER
What's Your Angle
In this angle worksheet, students identify five shapes and then place them together to form a square. Afterward, they answer three questions regarding the number of right, acute and obtuse angles. This one-page worksheet contains a total...
Curated OER
The Hot Dog Stand: Combinations
In this combination worksheet, students rearrange integers to determine the number of combinations that can be made from given numbers. This one-page worksheet contains one combination problem.
Curated OER
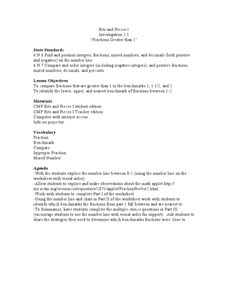
Bits and Pieces: Fractions Greater Than One
Students compare fractions. In this fraction worksheet, students examine the number line. Using the Internet, they explore models of numbers greater than one. Students complete multiple-choice worksheets.
Curated OER
Injustice on Our Plates: Immigrant Women
Students investigate the plight of undocumented workers. In this social justice lesson, students research undocumented workers as well as consumer boycott movements and write about their impressions.
Curated OER
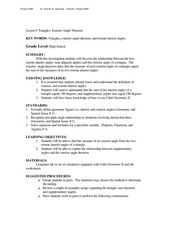
Triangle Exterior Angles Theorem
Students identify the measure of missing exterior angles. In this geometry instructional activity,students define and apply the exterior angle theorem to solve problems. They use Cabri software to create different angles and make...
Curated OER
Tropical Atlantic Aerosols
Students analyze NASA data from the Multi-angle Imaging Spectroradiometer. In this NASA data lesson, students access an assigned website to examine information from the MISR on the Terra Satellite. They determine how desert dust travels...
Curated OER
Marshmallow Moosy
Students stack several different colored marshmallows-one on top of the other-in the tall cylindrical container. They ct a cardboard disk to fit snugly inside of the container on top of the marshmallow stack using a compass if necessary....
Curated OER
Using Excel to Reference and Graph Live Data from a Web Site
Students collect live buoy data about water temperatures in the Gulf of Mexico from the Internet and work individually to organize their data and create a line graph using Excel Spreadsheet. Students analyze their data and examine any...

