Curated OER
Gold Rush California and its Diverse Population
Students compare contemporary cultural differences with historical differences based on population percentage. In this cross-curriculum Gold Rush/math lesson plan, students analyze aspects of California's Gold Rush population and...
EngageNY
Using Sample Data to Compare the Means of Two or More Populations
Determine whether there is a difference between two grades. Teams generate random samples of two grade levels of individuals. Groups use the mean absolute deviation to determine whether there is a meaningful difference between the...
Education World
The African American Population in US History
How has the African American population changed over the years? Learners use charts, statistical data, and maps to see how populations in African American communities have changed since the 1860s. Activity modifications are included to...
PBS
Population Simulation with M&M's
Math and M&Ms® go great together when introducing a modeling activity. Allow your learners to simulate population growth and decay of fish in a pond and share their reasoning for the change in fish. With such an impact we have on our...
EngageNY
Populations, Samples, and Generalizing from a Sample to a Population
Determine the difference between a sample statistic and a population characteristic. Pupils learn about populations and samples in the 14th portion in a unit of 25. Individuals calculate information directly from populations called...
EngageNY
Using Sample Data to Compare the Means of Two or More Populations II
The 23rd segment in a series of 25 presents random samples from two populations to determine whether there is a difference. Groups determine whether they believe there is a difference between the two populations and later use an...
Regents Prep
Activity to Show Sample Population and Bias
There is bias in many aspects of our lives, and math is no exception! Learners explore provided data to understand the meaning of biased and random samples. The resource includes various data sets from the same population, and...
EngageNY
Estimating a Population Proportion
Find the percent of middle schoolers who want the ability to freeze time. The 21st installment in a series of 25 has groups collect a random sample of respondents who answer a question about superpowers. Using sample statistics,...
Curated OER
Social Studies: Area and Population Density
Math scholars of many ages examine the concept of population density and then discuss the significance of the population densities of Minnesota and China. They figure the population density of their school.
Curated OER
China's Population Growth
Learners collect data from China's population growth and determine the mean, median, and mode from the data. For this data lesson plan, pupils determine probabilities and use them to make predictions.
PBS
Adventures With The Fish Pond: Population Modeling
Build up from the previous activity where your learners charted the population growth and decay of a fish pond with M&Ms®. Have them look at the data from that activity and create a Now-Next, or recursive equations, to predict the...
Concord Consortium
Center of Population
Let the resource take center stage in a lesson on population density. Scholars use provided historical data on the center of the US population to see how it shifted over time. They plot the data on a spreadsheet to look the speed of its...
EngageNY
Population Problems
Find the percent of the population that meets the criteria. The 17th segment of a 20-part unit presents problems that involve percents of a population. Pupils use tape diagrams to create equations to find the percents of subgroups of the...
EngageNY
Understanding Variability When Estimating a Population Proportion
Estimate the proportion in a population using sampling. The 20th installment in a series of 25 introduces how to determine proportions of categorical data within a population. Groups take random samples from a bag of cubes to determine...
EngageNY
Sampling Variability
Work it out — find the average time clients spend at a gym. Pupils use a table of random digits to collect a sample of times fitness buffs are working out. The scholars use their random sample to calculate an estimate of the mean of the...
Curated OER
Assessing and Investigating Population Data
Students examine population projections. In this population data lesson, students research and collect data on the population of the United States. They explore and conclude future population growth patterns. Students construct tables...
Curated OER
Water Studies: Precipitation and Population
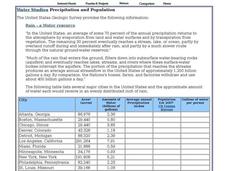
For this water worksheet, students complete the chart about precipitation and population and answer short answer questions. Students complete 14 rows in the chart and answer 4 questions.
Curated OER
How Big is Big?
Geography learners compare and contrast population densities throughout the world. Using maps, they estimate the relative size of the world's regions and populations. They develop analogies to discover the world they live in and...
Curated OER
Graphing Data
Seventh graders solve and graph 10 different problems that include various questions related to data on a graph. First, they create bar graphs to display the data given. Then, pupils determine the random sample of a population listing...
Curated OER
In the Wake of Columbus
Students explore how the population decreased in native cultures.
Curated OER
Population Growth in Yeasts
Students design an investigation using yeast. In this environmental engineering lesson, students design an investigation to determine how environmental factors affect the growth of yeast. They will collect quantitative data and discuss...
Curated OER
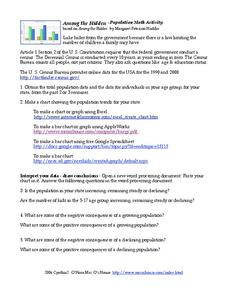
Among the Hidden - Population Math Activity
In this population worksheet, students collect data on population by researching the Census Bureau and then make online graphs and answer short answer questions about the data. Students complete 5 problems total.
Curated OER
Percentage of Populations with Diabetes
Learners calculate percentages. In this percentages lesson, students watch a video clip regarding diabetes. Learners discover how to calculate daily carbohydrate allowances as well as the percentage of the population with diabetes.
Curated OER
United States Population: Using Quadratic Models
In this United States population worksheet, students solve word problems about the United States population by using the quadratic formula. Students complete 6 problems.
Other popular searches
- Populations and Ecosystems
- Animal Populations
- Populations, Ecology
- Fish Populations
- Populations and Communities
- Deer Populations
- Bird Populations
- Limits on Populations
- Aboriginal Populations
- Human Populations
- Marine Mammals Populations
- Indigenous Populations


