Virginia Department of Education
Sales Tax and Tip
Don't forget to tip your server. Future consumers learn how to calculate sales taxes and tips. Pairs use actual restaurant menus to create an order and determine the total bill, including taxes and tips.
Curated OER
Stadiums in America
Let's play ball! A great springtime activity to learn about ratios. This activity challenges learners to draw stadiums to scale on standard letter paper and also on construction paper. This three-day lesson includes a pre-assessment...
Ohio Department of Education
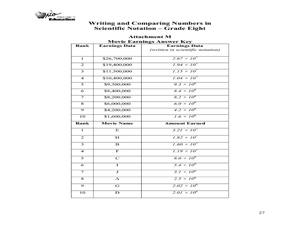
Writing and Comparing Numbers in Scientific Notation-Grade Eight
Explore scientific notation in this mathematics lesson. Young mathematicians explore multiple representations of large number in scientific notation through the use of models, visual representation and expanded form. The lesson provided...
Curated OER
Water - Planning for the Future
Students explore and examine the increases and/or decreases for water user groups: irrigation, municipal, manufacturing, steam electric power generation cooling, livestock, and mining. They utilize percentage changes during their...
Curated OER
Wildlife Sampling-Capture-Recapture
Seventh graders simulate the capture-recapture method of population sampling using beans. In this biology lesson, 7th graders calculate the total population of beans in the bowl. They assess whether this method is reliable or not.
Curated OER
Fickled Fractions
Students explore which fractions are made real in our world. They also show the relationship of cross multiplication and equivalent fractions To reinforce fraction skills.
Curated OER
Will There be Enough Water?
Students investigate water usage, water available, and water demand historically in the local area. They use projections of water usage, availability and demand up to the year 2050. Students use graphs to relate as well as compare and...
Curated OER
How Much Is Too Much?
Students examine population growth and collect data. In this statistics instructional activity, students create a scatter plot to represent the different species found in the water and are being harvested. They graph their data and draw...
Curated OER
Perimeter
Students explore the concept of perimeter. In this perimeter activity, students discuss how to find perimeter of various shapes. Students use the Perimeter Explorer applet to find the perimeter of various shapes.
Curated OER
Mathematics In You
Students construct ratios using the hand as data. They use examples of cortical and trabecular bone found in the long bones to measure circumference, diameter, length, and weight of long bones. They perform computations using growth...
Curated OER
Count on Math
Learners develop number sense up to a million. In this developing number sense up to a million lesson plan, students count their breaths in given time span. Learners use blocks representing 10's and 100's to create a million. Students...
Curated OER
Shots, Standings, and Shopping
Rates and ratios can easily be applied to real-world situations. Learners explore a series of websites in order to procure comparable data. They define ratios and rates, view videos, and use the internet to explore how ratios and rates...
Curated OER
Positive and Negative Numbers
Pupils use blocks and markers to illustrate the processes of adding, subtracting, multiplying and dividing integers. In this mathematics lesson, learners use Algebra blocks to demonstrate multiplying polynomials.
Curated OER
Introduction to the Concept of Probability
Middle and high schoolers have a clarified definition of probability, they explore about outcomes in probability and how to calculate experimental probability. They use computers to learn about probability.
Curated OER
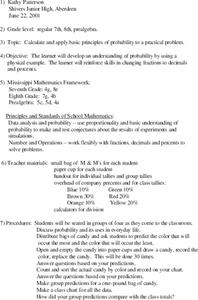
Probability using M & M's
Using M & M's candies, young statisticians predict the color distribution in a packet of candies and test their predictions against their group and the larger class. A review of converting between fractions, decimals, and percents...
Curated OER
Fire!, Probability, and Chaos
Upper elementary and middle schoolers work with the concept of probability. They are introduced to the concept of chaos. Learners graph and analyze using a line plot, work with mean, and are introduced to the concept of variance.
Curated OER
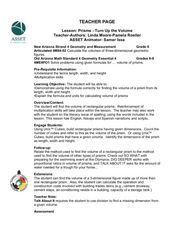
Prisms-Turn Up The Volume
Identify the length, width, and height of prisms. Critical thinkers calculate the volume of prisms given small amounts of information. They derive the formula given the length, width and height.
Curated OER
Sizing Up the Supersize Croc
Students examine and compare traits of humans and crocodiles. For this crocodile lesson students use a ratio to estimate the height of a person and compare that to a crocodile.
Curated OER
Texas History Math
Seventh graders practice math skills while they become familiar with Texas' Boom & Bust economy and the natural history of the east Texas Piney Woods.
Curated OER
Build a Skittles Graph
Students construct a bar graph with a given set of data. They calculate the ratio and percent of the data. Students discuss alternate ways of graphing the data as well as multiple strategies to approach the task.
Curated OER
Conversions: Metrics Made Easy
Students, in groups, measure and record each other's height. They identify measurement conversion methods and use online resources to convert measured heights to multiple systems.
Curated OER
Fashion Sense and Dollar Wise
Students find the cost of an outfit. In this percentages lesson, students look at ads, pick out an outfit, and find the sale price. They create a commercial and complete 4 included worksheets.
Curated OER
Buying My First Car
Learners pretend they are about to buy their first new car. They must do all the calculations necessary to estimate the cost of purchasing the car. They see that the math they learn in school really does have real-life applications.


