Hi, what do you want to do?
Mathed Up!
Stratified Sampling
Young mathematicians learn how to solve problems involving stratified sampling. They review concepts of sampling and proportionality by watching a video and then they complete a worksheet of questions on this topic.
Curated OER
Count The Letters
Students perform activities involving ratios, proportions and percents. Given a newspaper article, groups of students count the number of letters in a given area. They use calculators and data collected to construct a pie chart and bar...
Curated OER
Sampling Snoops
Students practice formulating a hypothesis and designing an experiment to test the hypothesis. They identify several sampling techniques they can use to test their hypotheses.
Curated OER
Statistics Newscast in Math Class
Students study sports teams, gather data about the teams, and create a newscast about their data. For this sports analysis lesson, students research two teams and define their statistical data. Students compare the two teams, make...
Curated OER
Comparison of Snow Cover on Different Continents
Students use the Live Access Server (LAS) to form maps and a numerical text file of snow cover for each continent on a particular date. They analyze the data for each map and corresponding text file to determine an estimate of snow cover...
Curated OER
Aruba Cloud Cover Measured by Satellite
Students analyze cloud cover and to compose written conclusions to a given related scenario. They submit a letter of response and a report detailing their calculations and conclusions.
Curated OER
Whose Breakfast isn't for the Birds?
Learners explore coffee production. In this cross-curriculum rainforest ecology lesson, students research regions where coffee comes from and investigate how the native birds in the rainforest are effected by coffee...
Curated OER
Childhood Obesity
Students identify a question to generate appropriate data and predict results. They distinguish between a total population and a sample and use a variety of methods to collect and record data. Students create classifications and ranges...
Curated OER
Snow Cover By Latitude
Students examine computerized data maps in order to create graphs of the amount of snowfall found at certain latitudes by date. Then they compare the graphs and the data they represent. Students present an analysis of the graphs.
Khan Academy
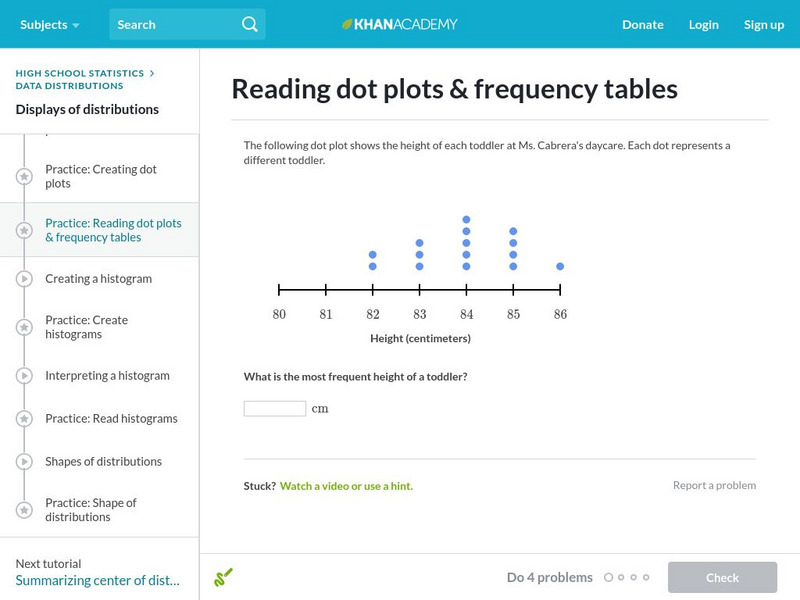
Khan Academy: Reading Dot Plots & Frequency Tables
Practice reading basic dot plots and frequency tables. Students receive immediate feedback and have the opportunity to try questions repeatedly, watch a video or receive hints.
Khan Academy
Khan Academy: Reading Dot Plots and Frequency Tables
In this exercise, students practice reading dot plots and frequency tables. Students receive immediate feedback and have the opportunity to get hints and try questions repeatedly.
Khan Academy
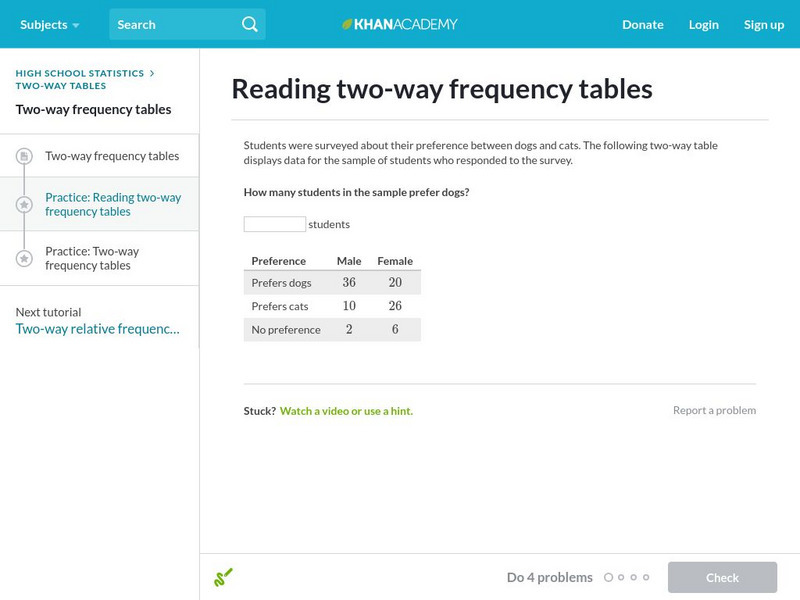
Khan Academy: Reading Two Way Frequency Tables
Practice interpreting two-way frequency tables. For example, what does the cell in the top left tell you? Students receive immediate feedback and have the opportunity to try questions repeatedly, watch a video, or receive hints.
Khan Academy
Khan Academy: Reading Two Way Relative Frequency Tables
Practice interpreting two-way relative frequency tables Students receive immediate feedback and have the opportunity to try questions repeatedly, watch a video or receive hints.


