Bowland
Counting Trees
Let's find a way to determine how many there are. Given a diagram of trees on a plantation, pupils devise a way to estimate the number of old and new trees. Using their methods, learners create estimates for the number of the two types...
Bowland
Lottery
Take a chance on raising money. Learners calculate probabilities to determine whether a lottery is a good way to raise money. Pupils determine the number of combinations of choosing two numbers between one and six. Using the sample...
US Department of Commerce
Exploring Sampling Variability - Higher Education Attainment Across The United States
More education in statistics is always beneficial. Given cards that provide the proportion of adults with bachelor's degrees in 10 random US states, scholars individually determine the sample percentage of states in which more than 30...
US Department of Commerce
Sample Means - Exploring Sampling Variability
Sample an excellent resource on sampling variability. Pupils analyze census data on the percentage of homes in each state that have Internet access. They take random samples of different sample sizes, determine the sample means, and then...
US Department of Commerce
How Are Single-Parent Households Distributed Across the United States?
There sure are a lot of single-parent households in the country. After selecting one of four US regions to investigate, pupils create dot plots and box plots on the percentage of single-parent households with male parents and female...
US Department of Commerce
Does the Percentage of People Who Walk to Work in Cities Vary with Population Size?
To walk or not to walk? Pupils create box plots comparing the percentage of residents who walk to work in large, medium, and small cities. Using the box plots, class members compare the data that reflects available statistics. Scholars...
Radford University
Connecting Theoretical and Experimental Probability
Play some games, develop a law, and then call it a day. Learners first perform a small number of trials for a probability experiment, then predict the result for a larger number of trials. They then compile data from the entire class to...
Radford University
AFDA Probability and Law of Large Numbers
The more trials scholars perform, the closer they'll likely be to the true value. After designing a probability experiment, young mathematicians conduct the experiment for five different numbers of trials. They then analyze the results,...
National Wildlife Federation
Gator Hole Graphics
Climate changes are cyclic so how do these changes impact species that live in different habitats? Learners examine the rainfall levels in a specific swamp habitat. They also review graphical data and tell a story about how the levels...
Curated OER
Mystery Spinners
Take a spin with probability. Given a set of clues about the probability of events on a spinner, groups create their own device to match the clues. Using a jigsaw strategy, groups share their spinners and strategies with other groups....
McGraw Hill
Lesson 12: Absolute Mean Deviation
Learn a different way to determine variability. An informative lesson provides directions on how to calculate the mean absolute deviation of a data set. Pupils use examples to learn the process and then practice finding the mean absolute...
Newspaper Association of America
By the Numbers: Mathematical Connections in Newspapers for Middle-Grade Students
A cross-curricular resource teaches and reinforces mathematical concepts with several activities that use parts of a newspaper. Scholars use scavenger hunts to find the different ways math is used in the paper along with using data...
Pace University
Grades 7-8 Mean, Median, and Mode
Take a central look at data. The differentiated lesson plan provides activities for pupils to calculate central tendencies. Scholars begin choosing three central tendency activities from a Tic-Tac-Toe board. Learners then choose from...
Pace University
Grade 7 Earth Day Statistics with Circle and Bar Graphs
Take a tiered approach to studying waste. The lesson uses Earth Day to present differentiated instruction around using circle and bar graphs. Each group gets a cube based on their tiers and works collaboratively as well as individually...
Concord Consortium
People and Places
Graph growth in the US. Given population and area data for the United States for a period of 200 years, class members create graphs to interpret the growth over time. Graphs include population, area, population density, and population...
PHET
Plinko Probability
It's a good thing the resource dropped into your radar. Young mathematicians use an app that randomly drops balls through a Plinko game and into bins. They compare the distribution to that of an ideal binomial distribution.
CCSS Math Activities
Smarter Balanced Sample Items: 7th Grade Math – Target H
Not one but two box plots. How will your pupils fare? Assess their understanding of box plots by having them compare two populations. The eighth of nine installments in the Gr. 7 Claim 1 Item Slide Shows series, the resource has them...
CCSS Math Activities
Smarter Balanced Sample Items: 7th Grade Math – Target I
The probability is high that these questions will challenge your pupils! The ninth and final installment of the Grade 7 Claim 1 Slideshow series, a set of items assesses the understanding of simple and compound probability concepts....
CCSS Math Activities
Smarter Balanced Sample Items: 7th Grade Math – Target G
Don't leave learning to chance! Assess your class's understanding of random sampling and making inferences using questions from the experts at Smarter Balanced. As the seventh of nine parts in the Gr. 7 Claim 1 Item Slide Shows series,...
Corbett Maths
Quantitative and Qualitative Data
Classify the Big Ben of all data with a video that defines quantitative and qualitative data. Given data about Big Ben, the presenter classifies each piece based upon the definitions. In the Types of Data worksheet, individuals show they...
Corbett Maths
Discrete and Continuous Data
Let's be discrete about the types of data. A short video provides the definitions of discrete and continuous data. After providing the definitions, the resource takes different types of data and sorts them based on type and provides an...
Corbett Maths
Median for a Frequency Table
Try to find the middle of a frequency table. Using a frequency table of ages, the video shows how to use a formula to determine the position of the median. The resource uses frequency tables with both even and odd numbers of data points.
PBS
The Lowdown — Exploring Changing Obesity Rates through Ratios and Graphs
Math and medicine go hand-in-hand. After viewing several infographics on historical adult obesity rates, pupils consider how they have changed over time. They then use percentages to create a new graph and write a list of questions the...
Corbett Maths
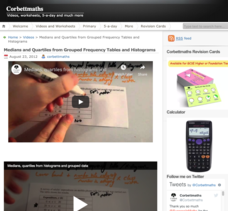
Medians and Quartiles from Grouped Frequency Tables and Histograms
Determine medians within a group. Given data represented as a frequency table of grouped data, the video demonstrates finding an estimation for the median. After finding the group where the median resides, the presenter uses a formula to...


