Mathematics Assessment Project
Printing Tickets
That's the ticket! Pupils write and investigate two linear functions representing the cost of printing tickets. Individuals then determine which of two printing companies would be a better buy.
MARS, Shell Center, University of Nottingham
Defining Regions Using Inequalities
Your young graphers will collaboratively play their way to a better understanding of the solution set produced by the combining of inequalities. Cooperation and communication are emphasized by the teacher asking questions to guide the...
Curated OER
Eliminate What?
Students are introduced to the elimination method in Algebra. As a class, they solve two linear equations with two unknowns using this new method. They discuss the positive and negative aspects of using this method to solve problems. ...
Curated OER
Kinetic Energy and Voltage
In this kinetic energy and voltage worksheet, students use the formula that relates the kinetic energy of a particle to its voltage to answer 3 questions. Students manipulate the equation to solve for the speed of particles given...
Curated OER
NY State Testing Program
In this math exam learning exercise, 8th graders review geometric and algebraic concept including angles, polygons, equations, factoring and addition and subtraction, quadrilaterals, trig and circles. They take a...
Curated OER
Relating Distance and Velocity Over Time
Students calculate the distance and velocity over time. In this algebra lesson, students graph a linear function to represent the distance vers time travel. They interpret their graphs and draw conclusion.
Curated OER
Slip Slide'n Away
Young scholars analyze the sliding of boxes along a warehouse floor. In this algebra lesson, students connect math and physics by calculating the friction created by the sliding of each box. They develop faster method to move the box,...
Curated OER
La Toteca- A Tropical Paradise
Students collect data on the time of the ferry. In this algebra instructional activity, students use the data to predict a ferry schedule. They also compute the depth where oxygen would be needed when diving.
Curated OER
Leap Into Exponential Functions
Young scholars use properties of exponents to solve equations. In this algebra lesson, students add, subtract, multiply and divide exponential functions. They graph and differentiate between exponential growth and decay.
Curated OER
Leap Into Exponential Functions
Studens identify the properties of exponents. In this algebra lesson, students grapha nd solve equaitons of exponential functions. They add, subtract, multiply and divide using exponents.
Mathematics Vision Project
Module 6: Congruence, Construction, and Proof
Trace the links between a variety of math concepts in this far-reaching unit. Ideas that seem very different on the outset (like the distance formula and rigid transformations) come together in very natural and logical ways. This...
Curated OER
Exploring Quadratic Graphs
In this algebra worksheet, learners solve quadratic equations. They factor and graph their solutions. There are 5 questions with an answer key.
Curated OER
Using Inequalities to Problem Solve
Young scholars explore inequalities. In this Algebra I lesson plan, students solve and graph linear inequalities involving addition, subtraction, multiplication, or division. Young scholars use inequalities to solve and graph...
Curated OER
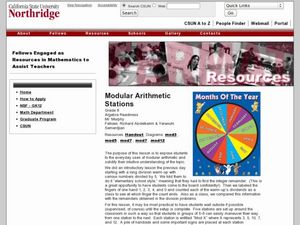
Modular Arithmetic Station
Eighth graders find ways to use math everyday. In this algebra lesson, 8th graders model equation and problem solving as they multiply and divide numbers. They split up in to groups as they perform hands on operations.
Power to Learn
How Much Space Do We Have?
Census-takers view the Internet to find the total population of a city and its total land area. They work with different mathematical scenarios that involve populations and land area in their city. They complete math problems and unit...
Curated OER
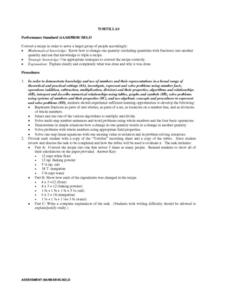
Tortillas
Learners convert recipes for tortillas. They calculate the amounts of ingredients as they convert recipes and write an explanation of the task to demonstrate their calculations. After reviewing their calculations, they demonstrate how...
University of Nottingham
Drawing to Scale: A Garden
See how design and geometry go hand in hand. The activity asks learners to use geometry to design a backyard garden given dimensions of each feature. Scholars work with ratios and scale to develop an accurate scale drawing that includes...
Curated OER
Conductivity of salt Solutions
Students investigate the concentration level of solutions. In this math/science activity, students identify three different ionic compounds. They predict the conductivity of each using their collected data.
Curated OER
How High Are the Clouds?
Young scholars analyze height and collect data to create a graph. In this statistics lesson, students use central tendencies to analyze their data and make predictions. They apply concept of statistics to other areas of academics to make...
Curated OER
Cannonball
Students calculate the speed, motion and distance of a projectile. In this geometry activity, students obtain measurements while calculating velocity. They graph their results and make predictions.
Curated OER
Does Music Cam the Savage Beast?
Students collect, graph and analyze data. In this statistics lesson, students measure the heart beat of a person as they listen to music. They use the CBL and TI to create a graph, analyzing the outcome.
Curated OER
Graphing Inequalities in Two Variables
This study guide is a great resource to help you present the steps to graphing linear inequalities. Show your class two different ways to graph an inequality and work on a real-world example together. The document could also be easily...
Curated OER
Inquiry Unit: Modeling Maximums and Minimums
Young mathematicians explore the maximun area for patio with the added complexity of finding the mimimum cost for construction. First, they maximize the area of a yard given a limited amount of fence and plot width v. area on a...
University of Colorado
Distance = Rate x Time
Every year, the moon moves 3.8 cm farther from Earth. In the 11th part of 22, classes use the distance formula. They determine the distance to the moon based upon given data and then graph Galileo spacecraft data to determine its movement.


