PBS
Working with Coordinate Planes: Assessments
It's time for scholars to show what they know about coordinate planes with a collection of three assessments. The exams' objectives include plotting points on a single grid, measuring using the distance formula, and identifying points on...
Curated OER
Data Analysis, Probability, and Discrete Math: Lesson 5
Eighth graders are read the material that is printed in boldface type inside the boxes. Information in regular type inside the boxes and all information outside the boxes should not be read to them. They then find the mean, median,...
Curated OER
Discovering PI
For this pi worksheet, students identify and complete 4 different problems that include pi and graphing data points. First, they complete the chart at the top by measuring the diameter and circumference of each object. Then, students...
Curated OER
Price of Apples- Linear Data
Students collect data and create a graph. In this algebra instructional activity, students describe functions graphically, algebraically and verbally. They identify functions as being independent and dependent using variables.
Shodor Education Foundation
Multi-Function Data Flyer
Explore different types of functions using an interactive lesson. Learners enter functions and view the accompanying graphs. They can choose to show key features or adjust the scale of the graph.
Curated OER
Just Me and My Shadow
Students take measurements throughout the day using a simple sundial called a gnomon. They record the results on a Data Log and convert from English units to metric (S.I.) units. Data points are plotted on the same graph and analyzed.
Curated OER
Line Graphs
In this line graphs worksheet, 8th graders solve and complete 20 different problems that include reading various line graphs. First, they use the information provided in each line graph to determine the correct response to each of the...
Scholastic
Study Jams! Double-Line Graphs
With two summers of babysitting money, Mia needs a way to compare her earning from both years. Show your learners that they can organize the data onto a double-line graph to easily compare which summer was more profitable. The lesson...
Curated OER
Float the Boat
Students collect data and analyze it using a graph. In this algebra activity, students identify different bodies of water and relate the flowing to math. They collect data on the rate of flow and the height of flow. They analyze the data...
Curated OER
La Toteca- A Tropical Paradise
Students collect data on the time of the ferry. In this algebra lesson, students use the data to predict a ferry schedule. They also compute the depth where oxygen would be needed when diving.
Curated OER
Math: Football Fever Fun
Students compile statistics from high school or other football team and construct a spreadsheet on which to record their findings. Using Chart Wizard to analyze the data, they construct charts and graphs for a visual display of the...
Curated OER
Probability Lesson Plan
Your learners will examine probability through experiments and dice games. Using a computer, your class will perform simple experiments to collect and analyze data to determine the probability of different experimental results. Students...
Curated OER
Canada's Climate: Temperature and Rainfall Variations
Middle schoolers analyze data about various climates in Canada. In this data analysis and climate lesson, students use Canada Year Book 1999 to complete a worksheet and make connections between precipitation and temperature in different...
Curated OER
Probability Two Events
Students investigating the concept of probability practice the concept using a variety of different example problems. The lesson plan is delivered in a question and answer format. The frequency of answers is recorded in a data table for...
Curated OER
Influence and Outliers
Using the TI-Nspire calculator, statisicians identify outliers and their effect on the least-squares regression line. In finding the line of best fit, they determine what points will affect the least squares regressions and what points...
Shodor Education Foundation
Graphit
No graphing calculator? No worries, there's an app for that! Young mathematicians use an app to graph functions. In addition, they can also plot data points.
Curated OER
Data Analysis
Students double check their data collections of Top 20 singles that they've been collecting for several days. Types of data is reviewed in detail and a variety of questions are asked for retention factors of mastery. They draw a tally...
Curated OER
Long Distance Phone Plans
In this long distance phone plane worksheet, young scholars compare various phone plans and determine which long distance plan has the greatest savings. Students support their answers visually through the use of tables and graphs. They...
National Museum of Nuclear Science & History
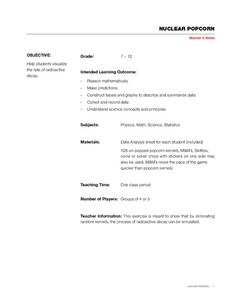
Nuclear Popcorn
Make your instructional activity on radioactive decay pop with this lab exercise. Using popcorn kernels spread over a tabletop, participants pick up all of those that point toward the back of the room, that is, those that represent...
Balanced Assessment
Who's Left?
If you're not right-handed, are you wrong-handed? Young statisticians calculate the percentage of left-handed people using a given data set in the assessment task. They plot data on a scatter plot and consider how the line of best fit...
Curated OER
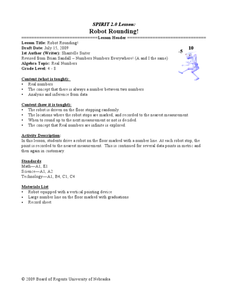
Robot Rounding!
Students collect data on a robot and relate the behavior to prove there is an infinite minute set of numbers. In this algebra lesson, students verify that there is always a number between two numbers. They analyze and make inference from...
Curated OER
Spaghetti Graphs
Students work in pairs to test the strength of spaghetti strands. They collect and graph data to determine a line of best fit. Students create a linear equation to interpret their data. Based on the data collected, students predict...
Mathed Up!
Frequency Polygons
Frequency polygons are a different way to represent frequencies over intervals. Pupils take frequencies for intervals of data from a frequency table and plot them as a frequency polygon. Budding mathematicians find information about the...
Curated OER
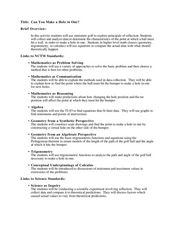
Can You Make a Hole in One?
Young scholars relate miniature golf to reflection of an image. In this algebra instructional activity, students collect and graph data as they study linear equations. They apply properties of graphing to solve real life scenarios.


