Curated OER
Triangles
Students identify triangles in the real world and construct their own triangle using drinking straws. They explore abstract triangles and find additional geometric shapes such as trapezoids. Students discuss similar shapes and examine...
Yale University
Airplane Mathematics
The history of aerodynamics is rich with experimentation and international collaboration. Author Joyce Bryant relays this dynamic past and provides math word problems using the formula of lift, the force that makes airplanes fly. She...
Curated OER
A Point of Intersection
Students factor and solve systems of equation. In this algebra lesson plan, students identify the point of intersection using substitution, elimination and graphing. They write an equation given a system and a graph.
Curated OER
Solutions, Solutions, Could it Be?
Students graph and solve linear system of equations. In this algebra activity, students use algebraic and graphing methods to solve their systems. They find the point of intersection for their solution and draw inference from their data.
Curated OER
Circles And Cylinders
Middle schoolers investigate some of the mathematical concepts involved in the study of circles. They first practice finding the circumference of a circle by finding the diameter and performing the calculation. The instructional activity...
Curated OER
Where in the World Am I: Latitude And Longitude
Pupils demonstrate their knowledge in using latitude and longitude measurements to find locations on a map, especially places in Hawaii.
Curated OER
Finding the Area of a Parallelogram with Translations
Students calculate the area of a parallelogram. In this geometry lesson, students perform translation using a coordinate plane and coordinate pairs. They perform translation on other polygons.
Curated OER
Finding the Area of a Parallelogram with Translations
Students calculate the area of parallelograms. In this geometry lesson, students identify properties of parallelograms and use to to solve problems. They create polygons using Cabri software.
Curated OER
Race The Rapper: Slopes
Students calculate the slope of the equation In this algebra lesson, students graph coordinate pairs of linear equations and identify the relationship between x and y values and slope. They differentiate between functions and relations....
Curated OER
Geometric Bingo
Students explore the concept of geometric shapes. In this geometric shape lesson, students play bingo to review geometric shapes. Students identify the shape being described by the teacher and put a marker on their bingo card.
Alabama Learning Exchange
The State Capital of Stem and Leaf
Students explore the concept of stem and leaf plots. In this stem and leaf plots lesson, students plot the 50 US states' capitals on a stem and leaf plot according to the first letter of each state. Students compare their stem and leaf...
Curated OER
The Search for Pythagoras' Treasure
Students identify and define properties of triangles. In this geometry lesson, students identify the missing sides and angles of right triangles. They use the rules of the Pythagorean Theorem to solve their problems.
Curated OER
Graphing System of Equations
Students solve system of equation. In this algebra lesson, students graph, substitute and eliminate to solve system of equation. They identify the point of intersection and how many solution each system will have.
Curated OER
Solve a System of Inequalities
In this system of linear inequalities activity, students solve 5 problems with the graphing method and are given 2 examples with multiple steps to follow.
Curated OER
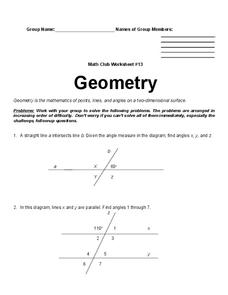
Geometry
In this geometry worksheet, students find the sum of angles, label angles, and more. Students complete 6 questions total on this worksheet.
Curated OER
Median of a Trapezoid
Students find the median of trapezoids and other polygons. In this geometry instructional activity, students identify important properties of trapezoids. They create trapezoids and polygons using Cabri software.
Curated OER
Pictures of Data: Post Test
In this data worksheet, students answer multiple choice questions about charts and graphs. Students answer 10 questions total.
Curated OER
Properties of Special Parallelograms
Students identify properties of parallelograms. In this geometry lesson, students label polygons as parallelogram or not. They define and label the properties of a kite.
Curated OER
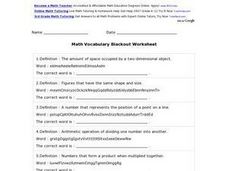
Math Vocabulary Blackout worksheet
In this math vocabulary worksheet, students read the definition of the math vocabulary word and then write the word. Students write 15 math vocabulary words.
Curated OER
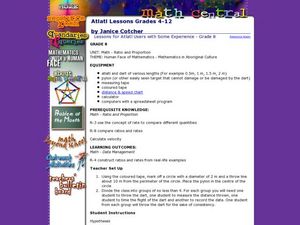
Atlatl Lessons for Grade 8
Eighth graders explore the weapons of the Aboriginal people. In this eight grade math/science instructional activity, 8th graders collect and analyze data regarding the speed and distance of a dart thrown with an atlatl. Students...
Curated OER
Seeing Double
Students develop an intuitive definition for symmetry after viewing a PBS video. They examine asymmetrical patterns and demonstrate their knowledge by changing them to symmytrical.
Curated OER
Analyzing Graphs and Data
Students collect and analyze data. In this statistics lesson, students graph their data and make inferences from the collected data. They display their data using graphs, bar graphs, circles graphs and Venn diagrams.
Curated OER
The Dog Days of Data
Students practice an alternative form of data presentation. They practice sequencing data, identifying the stem-and-leaf, creating stem-and-leaf plots, and drawing inferences from the data by viewing the plots.
Curated OER
The Dog Days of Data
Students are introduced to the organization of data This lesson is designed using stem and leaf plots. After gather data, they create a visual representation of their data through the use of a stem and leaf plot. Students
drawing...
Other popular searches
- Fractions on a Number Line
- Fractions Number Lines
- Integer Number Line
- Grade One Linear Measurement
- Rounding With Number Lines
- Double Number Lines
- Number Line Addition
- Fraction Number Lines
- Decimals on a Number Line
- Intersection of Two Lines
- Number Line Graphs
- Two Step Linear Equations


