Curated OER
Unit 5 Lesson 01: Graphing on a Number Line
Math masters are introduced to graphing inequalities on a number line. After reviewing inequality symbols, they practice representing them on a worksheet. This simple lesson serves its purpose.
Curated OER
Graphing Solutions To Inequalities On A Number Line
Eighth graders graph solutions to problems on a number line. After discussing algebraic expressions, 8th graders discuss how to solve them using an inequality. They observe examples and then work problems at their desks and on the...
Curated OER
Least Squares Fit Line
Practice makes perfect! Learners estimate the least squares fit line for a set of data. They understand error involved in least squares fit lines, and solve application problems using least square fit lines.
101 Questions
The Mystery Line
Take the mystery out of linear functions. Provided an image with no scale, learners guess where the line that connects them might cross the y-axis. After providing the coordinates of the points, they realize scale is an important...
Curated OER
Polygons
This resource provides 5 different worksheets on the topic of polygons and symmetry. These worksheets cover rotational symmetry, lines of symmetry, symmetry of regular polygons, special quadiralaterals, and polygon transformation. The...
Curated OER
Guess-timating Fun
Learners estimate the number of items in a jar and write their estimate boldly on a piece of paper. They line up holding their numbers. Then, they calculate the median, mean, mode and average of the guesses.
Illustrative Mathematics
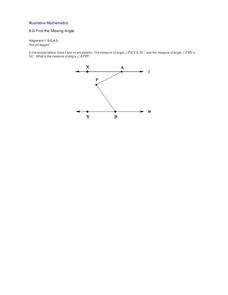
Find the Missing Angle
This one activity requires young geometers to pull together information they are currently learning with things they have learned previously. Here they rely on understanding something about parallel lines, alternative interior angles,...
Curated OER
Graph It!
There is more than one way to represent data! Learners explore ways to represent data. They examine stacked graphs, histograms, and line plots. They conduct surveys and use stacked graphs, histograms, or line plots to chart the data they...
Curated OER
Linear Equations
Eighth and ninth graders solve and graph 42 different problems that include writing various equations and graphing them on a grid. First, they create a table for each equation and graph it on a grid locating the x-and y-intercepts. Then,...
Shodor Education Foundation
Racing Game with One Die
Pupils roll a die to figure out which car advances on a race track. They determine the rules for each car moving forward and, given the statistics of the winner, compare if it matches their predictions.
Curated OER
Fantasy Baseball
Check out this thematic unit, based on the game of baseball. Learners investigate numbers and number relations as they become familiar with some of the basic terminology associated with the game. They focus their attention on actual...
Illustrative Mathematics
Fixing the Furnace
This comprehensive resource applies simultaneous equations to a real-life problem. Though the commentary starts with a graph, some home consumers may choose to begin with a table. A graph does aid learners to visualize the shift of one...
CK-12 Foundation
Understand and Create Histograms: Car Sales
Create a history of car sales. Pupils create a histogram/bar graph to show the number of car sales made during the week. Using the data display, learners calculate numerical summaries of the data and find the percent of cars sold during...
Illustrative Mathematics
Equations of Lines
The intent of this resource is to show algebra learners that there is a proportional relationship between two lines that have an intersecting point. As the coordinate x increases by a constant, the y coordinate also increases. It will...
Google
Midpoint and Distance Foldable
Support young mathematicians with learning the concepts of midpoint and distance with this foldable resource. Offering both graphic examples and written equations, this reference clearly demonstrates for students how these key terms...
Curated OER
Comparing and Ordering Integers
Students compare and order integers on an umber line. In this algebra lesson, students differentiate between positive and negative numbers. They plot point in the correct order on a number line.
EngageNY
Representations of a Line
Explore how to graph lines from different pieces of information. Scholars learn to graph linear functions when given an equation, given two points that satisfy the function, and when given the initial value and rate of change. They solve...
Curated OER
Graphing Lines by Graphing Two Points
Use a graphing lines worksheet to have your mathematicians graph the line of a given equation and plot specified points. The first 10 problems have a given equation, and two values. The next 10 problems have a given equation, but your...
Ed Migliore
Linear Equations in Two Variables
This traditional textbook style unit includes vocabulary, a direct explanation section, examples, practice problems that directly line up with the explanations and examples, and a unit summary review and practice problems. Learners get...
Curated OER
Graphing Inequalities in Two Variables
This study guide is a great resource to help you present the steps to graphing linear inequalities. Show your class two different ways to graph an inequality and work on a real-world example together. The document could also be easily...
Noyce Foundation
Between the Lines
Explore linear and square dimensions by comparing areas of similar figures. A creative set of five activities designed for elementary through high school classes asks young scholars to compare areas of specific polygons. The first two...
College Preparatory Mathematics
Using Elimination To Find the Point of Intersection of Two Lines
Two example problems are solved on the first page using the elimination method with a pair of linear equations. Detailed explanations accompany the math. The second page provides 20 practice problems and their answers. This would be a...
Gatsby Charitable Foundation
Four Activities Using Straight Line Graphs
This math packet includes four different activities which puts linear equations and line of best fit in the context of real world applications. Each activity uses a different linear math modeling equation and asks the learners to...
Project Maths
Inequalities
Which number is bigger? Using a variety of activity sheets, this unit starts with the basics of inequalities and progresses through solving compound linear inequalities. Problems cover the range of inequalities including inequality word...
Other popular searches
- Fractions on a Number Line
- Fractions Number Lines
- Integer Number Line
- Grade One Linear Measurement
- Rounding With Number Lines
- Double Number Lines
- Number Line Addition
- Fraction Number Lines
- Decimals on a Number Line
- Intersection of Two Lines
- Number Line Graphs
- Two Step Linear Equations


