Curated OER
Chapter 3 Review
In this review worksheet, students read circle graphs and line graphs. They identify quadrants in a coordinate plane and match graphs to their appropriate linear equation. Students find the slope of a line and identify the y-intercept....
Curated OER
Review For Test 3
In this test worksheet, students interpret circle graphs, bar graphs, and line graphs. They match graphs to their appropriate linear equation. Students determine the slope of a line. There are 20 problems on this six page worksheet. ...
EngageNY
Graphing Systems of Equations
Expand on learners' understanding of quadratic-linear systems. Building on the graphic understanding developed in the previous lesson, pupils learn algebraic methods of solving the systems.
Curated OER
Math Handbook: Trigonometry
You'll be spinning in unit circles once you read through this jumbo-sized resource of everything you need to know about trigonometry. Each page has color-coded examples with explicit directions that detail the problems and formulas.
Curated OER
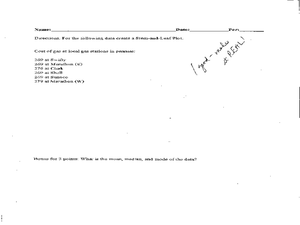
Stem and Leaf Plots and Circle Graphs
Students graph and plot numbers and analyze their data. In this algebra lesson, students identify the different properties of a stem and leaf plot. They decide which type of graph to use when it comes time to analyze their data.
Curated OER
Graphing Equations in Space
In this equations in two/three-dimensional space worksheet, students practice solving equations involving two/three-dimensional space configurations and finding the center and radius of spheres in twenty-six equations and two word problems.
Curated OER
Analyzing Graphs and Data
Students collect and analyze data. In this statistics lesson, students graph their data and make inferences from the collected data. They display their data using graphs, bar graphs, circles graphs and Venn diagrams.
Virginia Department of Education
Quadratic Curve of Best Fit
Class members create a table of the number of chords that can be drawn given the number of points on a circle. Pupils analyze the data created, find a function to fit to it, and use the function to make further predictions.
Curated OER
Solving Inequalities and Graphing on a Number Line
Students review solving equations. They solve an inequality and discuss how to graph it. Students work together on one inequality and then graph two on their own. This lesson contains links to a PowerPoint and a worksheet.
Curated OER
MAP Practice
In this geometry worksheet, students create circle, line and bar graphs using different comparisons of events. There are 24 questions with an answer key.
Curated OER
Circles and Angles
Young scholars identify tangents, chords and secants. In this geometry activity, students graph circles and identify angles created by secant lines, tangent lines and chords.
Curated OER
Math Lesson: What Do You Want to Know? - Country Statistics
Learners are able to identify the characteristics of a variety of graphs (i.e. bar graph, line graph, pie graph, scatter plot, population pyramids, etc.) They recognize how the type of data to be presented plays a role in choosing the...
Curated OER
An Introduction To Solving And Graphing Inequalities
Learners graph inequalities and solve the equations. In this algebra instructional activity, students graph their solutions on a number line and create an inequality for a word problem.
Alabama Learning Exchange
Technology for Displaying Trigonometric Graph Behavior: Sine and Cosine
Students explore the concept of sine and cosine. In this sine and cosine instructional activity, students work in groups to graph sine and cosine functions. Students examine how coefficients in various parts of each parent function...
Curated OER
Graph Figures From Equations
Students explore the concept of graphing figures from equations. In this graphing activity, students use Microsoft Math to graph figures from equations and write equations from graphed figures.
Willow Tree
Histograms and Venn Diagrams
There are many different options for graphing data, which can be overwhelming even for experienced mathematcians. This time, the focus is on histograms and Venn diagrams that highlight the frequency of a range of data and overlap of...
Concord Consortium
Shooting Arrows through a Hoop
The slope makes a difference. Given an equation of a circle and point, scholars determine the relationship of the slope of a line through the point and the number of intersections with the circle. After graphing the relationship, pupils...
EngageNY
Systems of Equations
What do you get when you cross a circle and a line? One, two, or maybe no solutions! Teach learners to find solutions of quadratic and linear systems. Connect the visual representation of the graph to the abstract algebraic methods.
5280 Math
Pythagorean Triples
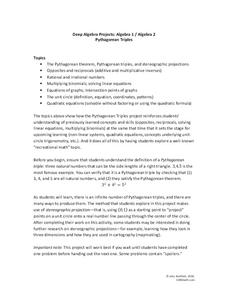
From Pythagorean triples to the unit circle. Learners use the Pythagorean Theorem to find Pythagorean triples and then relate their work to the unit circle in a fun algebra project. Their discovery that x^2+y^2 is always equal to one on...
Shodor Education Foundation
Conic Flyer
Graphing conics made easy. Individuals use an interactive to graph conic sections. The app can handle circles, vertical and horizontal parabolas, ellipses, and vertical and horizontal hyperbolas.
Virginia Department of Education
Nonlinear Systems of Equations
Explore nonlinear systems through graphs and algebra. High schoolers begin by examining the different types of quadratic functions and their possible intersections. They then use algebraic methods to solve systems containing various...
Concord Consortium
Functions by the Slice
Piece by piece ... dismantling a function can highlight interesting patterns. The task asks learners to slice functions in sections with the same vertical change. They then recreate the graph with these slices positioned horizontally....
Curated OER
Expressing Geometric Properties with Equations
Algebra and geometry are not interchangeable. Demonstrate why not with a series of problems that deal with the equations of circles and equations of lines that meet specific criteria.
Curated OER
Match The Graph Circles
High Schoolers engage in a study of circles and graphs that are related with the focus upon finding the center and radius. The lesson includes the suggestion of giving homework using circle problems before this one to create background...
Other popular searches
- Percent Circle Graph
- Circle Graph Worksheet
- Circle Graph Template
- Interpreting Circle Graphs
- Circle Graph Protractor
- Circle Graph Activity
- Reading Circle Graphs
- Circle Graphs Pie Charts
- Circle Graph Central Angle
- Bar and Circle Graphs
- Circle Graph in Excel
- Family Budget Circle Graph


