Willow Tree
Circle Graphs
Pie isn't just for eating! Scholars learn to create pie charts and circle graphs to represent data. Given raw data, learners determine the percent of the whole for each category and then figure out the degree of the circle that percent...
CK-12 Foundation
Interpretation of Circle Graphs: Northwest Region Population Pie
Given populations of the five Northwestern states, learners create a circle graph. Using the data and the pie chart, they make comparisons between the populations of the states. Finally, the pupils determine how the chart will change...
Curated OER
Circle Graphs and Percents
In this circle graph and percentages worksheet, learners fill in a chart, write percentages, calculate discounts, and more. Students complete 4 sets of problems.
EngageNY
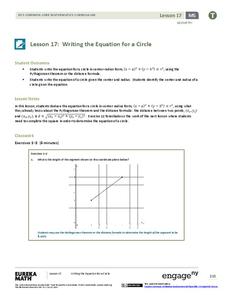
Writing the Equation for a Circle
Circles aren't functions, so how is it possible to write the equation for a circle? Pupils first develop the equation of a circle through application of the Pythagorean Theorem. The lesson then provides an exercise set for learners to...
Curated OER
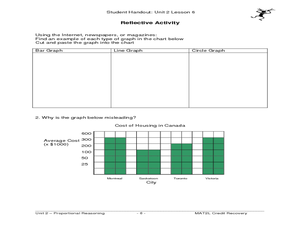
Leveled Problem Solving: Circle Graphs
In this circle graphs worksheet, students solve 6 word problems based on a circle graph about the most popular classes for sixth graders. Students calculate angle measures of circles for 2 of the problems.
Curated OER
Circle Graphs
In this circle graphs worksheet, students solve 10 different problems that include reading various circle graphs. First, they use graph 1 to determine how many students preferred which sport. Then, students use graph 2 to determine the...
Curated OER
Review Graphing Parabolas & Circles
Young scholars review how to graph parabolas. They practice graphing two different parabolas using the vertex and table method. They solve problems related to graphing circles, determining the radius and the center.
Curated OER
The Circle Graph
In this circle graph learning exercise, students complete problems involving many circle graphs including a compass rose, degrees, and more. Students complete 7 activities.
CK-12 Foundation
Displaying Categorical Variables: Spending Habits
Bar or circle graph—which is best? Given a circle graph and a total amount of money earned, pupils calculate the amount of money in each category. Learners use the calculated amounts to create a bar graph and compare the two displays.
Curated OER
Play It
There are a number of activities here that look at representing data in different ways. One activity, has young data analysts conduct a class survey regarding a new radio station, summarize a data set, and use central tendencies to...
EngageNY
Graphing the Tangent Function
Help learners discover the unique characteristics of the tangent function. Working in teams, pupils create tables of values for different intervals of the tangent function. Through teamwork, they discover the periodicity, frequency, and...
CK-12 Foundation
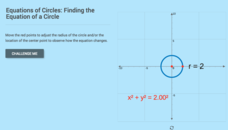
Equations of Circles: Finding the Equation of a Circle
It's all about location and size. With the aid of the interactive, pupils explore the relationship between the location and size of a circle and its equation. The learners use that relationship to determine the equation of a circle given...
Mt. San Antonio Collage
Graphing Trigonometric Functions
Double win with a comprehensive worksheet and an excellent worked out answer key. The worksheet itself is twelve pages and begins with the simple sine and cosine graphs, then, develops into the reciprocal trig functions.
Curated OER
Graph It!
There is more than one way to represent data! Learners explore ways to represent data. They examine stacked graphs, histograms, and line plots. They conduct surveys and use stacked graphs, histograms, or line plots to chart the data they...
Curated OER
Creating Circle Graphs with Microsoft Excel
Students create graphs of circles. In this geometry lesson, students use Microsoft Excel to create graphs. They construct the graphs using paper and pencil as well as the computer.
Curated OER
Holiday Greeting Cards: A Graphing Activity
Young scholars examine statistics about the popular type of greeting cards and create pie or bar chart using an online tool. They illustrate the sales statistics for the greeting cards before making the charts.
Illustrative Mathematics
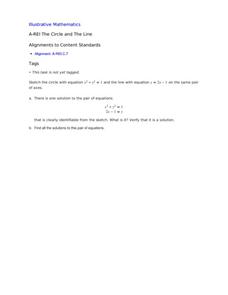
The Circle and The Line
Here is a resource where algebra learners show their understanding of a system of equations involving a circle and a line. Once graphed, learners see two points of intersection, one where the ordered pair is read, and a second where...
Curated OER
Using Bar Graphs to Understand Voting Patterns
Bar graphs are used as a way to study voting patterns in the United States. A variety of statistical data is presented in the graphs, and pupils must interpret the data in order to make a report to the class. Three excellent graphs,...
Willow Tree
Bar Graphs
Circles, lines, dots, boxes: graphs come in all shapes in sizes. Scholars learn how to make a bar graph using univariate data. They also analyze data using those bar graphs.
CK-12 Foundation
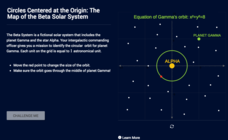
Circles Centered at the Origin: The Map of the Beta Solar System
Calculate galactic orbits in a far-out resource. Pupils drag a point on a circle to graph the orbit of a fictional planet. Using the equation, they find points through which the orbit passes. To finish the simulation, users determine the...
EngageNY
Graphing the Sine and Cosine Functions
Doing is more effective than watching. Learners use spaghetti to discover the relationship between the unit circle and the graph of the sine and cosine functions. As they measure lengths on the unit circle and transfer them to a...
Mathematics Assessment Project
Sorting Equations of Circles 1
Round and round we go. Learners first complete a task on writing equations of circles. They then take part in a collaborative activity categorizing a set of equations for circles based on the radius and center.
101 Questions
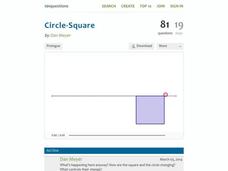
Circle-Square
How do the area and perimeters of circles and squares compare? A clever video illustrates the change in the area of a circle and square while their total perimeter stays the same. The task is for learners to predict the point where the...
Other popular searches
- Percent Circle Graph
- Circle Graph Worksheet
- Circle Graph Template
- Interpreting Circle Graphs
- Circle Graph Protractor
- Circle Graph Activity
- Reading Circle Graphs
- Circle Graphs Pie Charts
- Circle Graph Central Angle
- Bar and Circle Graphs
- Circle Graph in Excel
- Family Budget Circle Graph


