Curated OER
Multivariable calculus: Partial Derivatives
In this partial derivative worksheet, students calculate the derivative of given problems and find the equation of the tangent plane to an equation. This two-page worksheet contains five problems.
Curated OER
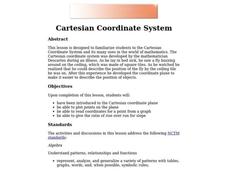
Cartesian Coordinate System
Students explore the Cartesian coordinate plane and plot points on the graph. They interpret coordinates for a point from the graph and give the ratio of rise over run for slope.
Curated OER
Variables on Both Sides
Students solve equations with variables on both sides of the equations. For this algebra lesson, students use addition, subtraction, multiplication and division to solve problems. They combine like terms and identify the unknown.
Curated OER
What is a Solution to a System?
Pupils define the solution to a system of equation. In this algebra instructional activity, students graph two line on the TI calculator and identify the point of intersection if there is any. They find one, zero or infinitely many...
Curated OER
Conjectures and Conclusions
Learners draw conclusions and make conjectures given a specific scenario. In this geometry lesson plan, students model real life scenarios using properties of triangles. They model number facts and explain why the outcome is what it is.
Curated OER
Get a Half-life!
Students use m&m candies as their sample set. They begin by counting the total number of candies to determine their sample size. Students put the candies into a cup and shake them gently before pouring them onto a paper plate. Count...
Curated OER
Hot Wheels
Students observe the action produced by toy cars. In this geometry lesson, students discuss motion and distance as they relate to the movement of a spherical object.They collect data and make conjectures based on their data.
Curated OER
Graphing and the Coordinate Plane
Students gain practice reading coordinates and plotting points by participating in the Coordinates! Game. They demonstrate and test their skills with graph paper and the Maze Game.
Curated OER
Numerical Analysis
In this math worksheet, students practice analyzing iterative methods. Then they use the reading to practice problem solving focusing upon convergence.
Curated OER
Direct Variation
In this Algebra II worksheet, 11th graders solve problems involving direct variation. The two page worksheet contains explanation, examples, and twenty-one problems. Answers are not included.
Curated OER
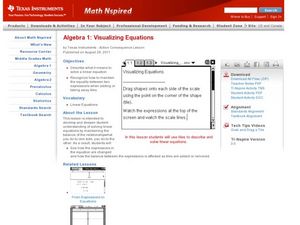
Visualiziing Equations
Students use visuals and words to solve equations. In this algebra lesson, students observe the necessary steps needed to add, subtract,multiply and divide to solve an equation. They graph their solution using the TI calculator.
Curated OER
Means of Growth
Students collect and graph data. In this statistics lesson, students analyze their plotted data using a scatter plot. They identify lines as having positive, negative or no correlation.
Curated OER
Walking on Air
Students collect and analyze data with a graph. In this statistics instructional activity, students use central tendencies to find the meaning of their data. They display the data on a Ti calculator.
Curated OER
Numerical Analysis/ Orders of Convergence of a Sequence
In this math worksheet, students examine the concept of orders of convergence for a sequence. They practice finding the different rates of convergence.
Curated OER
Comparison of Two Different Gender Sports Teams - Part 1 of 3 Measures of Central Tendency
Students gather and analyze data from sports teams. In this measures of central tendency instructional activity, students gather information from websites about sports team performance. Students analyze and draw conclusions from this...
Curated OER
Inverse Variation
In this algebra instructional activity, students find the inverse of an equations. They graph their solutions and analyze it. There are 8 questions.
Curated OER
Inequalities are Everywhere
In this Algebra I worksheet, 9th graders work with a family member to graph inequalities on a number line. The two page worksheet contains five questions. Answers are included.
Curated OER
The Slope of a Curve
Learners graph the slopes of a line using the intercepts. In this precalculus lesson, students identify the properties of a curve slope. They find the limit and use a graping calculator to graph their lines.
Curated OER
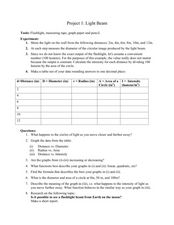
Light Beam
Students measure and convert between units. For this geometry lesson, students investigate through measurements of distances. They relate the properties of circle to solving problems with radius, diameter and area.
Curated OER
Worksheet 19
In this math activity, students use the following descriptions of a spring system to write a differential equation of the form my + γy + ky = F(x).
Curated OER
Amusement Park Physics
Students get up close and personal with principles of motion. For this physics lesson, students collect and analyze acceleration data on amusement park rides. Students use CBLs to collect data in this lesson.
Curated OER
What are the Odds
Students predict the-outcome of an event. In this algebra lesson, students compare and contrast the probability of an event occurring. They calculate the odds of a simple event and make estimation.
Curated OER
The Swinging Pendulum
Students observe a pendulum and graph their observation. In this algebra lesson, students use the TI calcualtor to graph the motion the pendulum makes. They analyze the graph and make predictions.
Other popular searches
- Graphing Linear Functions
- Linear Functions and Graphs
- Writing Linear Functions
- Nonlinear Functions
- Inverse Linear Functions
- Graphs of Linear Functions
- Nonlinear Equations
- Linear Functions Activity
- Linear Functions Math Models
- Linear Functions to Graph
- Linear Functions and Models
- Power Point Linear Functions


