Curated OER
Proving Triangles Congruent
Students examine Triangle Congruency. In this measurement comparison lesson, students use inductive, deductive and analytical thinking skills to prove triangle congruency. Students analyze and record their findings on activity worksheets.
Curated OER
Literal Equations
Students explore Literal Equations. In this literal equations lesson plan, students use the Internet to connect to links and solve linear equations. Students investigate, analyze and record their findings on various activity worksheets.
Curated OER
Celsius to Fahrenheit
Students convert degrees between two different units. In this algebra instructional activity, students graph linear equations and identify the line of best fit. They use their line of best fit to make predictions given a set of data.
Curated OER
Cantilevers
Students perform an experiment to find the linear relationship between the appllied weight and the bend of the cantilever. In this linear relationships activity, students follow detailed directions to set up an experiment. They add...
Rice University
Algebra and Trigonometry
Move on into trigonometry. An informative eBook takes the content of a College Algebra course and adds more relating to trigonometry and trigonometric functions. The content organization allows pupils to build upon their learning by...
Bowland
Alien Invasion
Win the war of the worlds! Scholars solve a variety of problems related to an alien invasion. They determine where spaceships have landed on a coordinate map, devise a plan to avoid the aliens, observe the aliens, and break a code to...
EngageNY
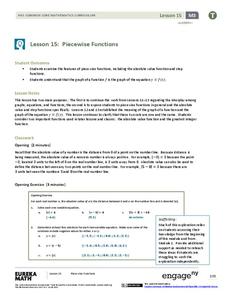
Piecewise Functions
Show your class members that if they can graph a linear function, they can graph an absolute value function. Groups create an absolute value graph using a table, then entertain the idea of an absolute value function defined as two pieces...
Cornell University
Math Is Malleable?
Learn about polymers while playing with shrinky dinks. Young scholars create a shrinky dink design, bake it, and then record the area, volume, and thickness over time. They model the data using a graph and highlight the key features of...
Curated OER
Transformations in the Coordinate Plane
Your learners connect the new concepts of transformations in the coordinate plane to their previous knowledge using the solid vocabulary development in this unit. Like a foreign language, mathematics has its own set of vocabulary terms...
Curated OER
Geometry and Shapes
High schoolers discuss and identify polygons and lines. In this geometry lesson plan, learners review liner, square and cubic units so they can incorporate it into the lesson plan on measurement and creating packing that are cost effective.
NASA
Lights on the International Space Station
Groups explore illumination with NASA's Lighting Environment Test Facility (LETF) as a context. Using the TI-Nspire app, groups determine the lux equation that models their simulation. They then use the lux equation to solve problems...
Bowland
AstroZoo
Rescue animals in the zoo by applying math concepts. Groups of learners solve three missions involving oxygen, food, and climate control. Each group selects an animal from one of four bio-domes.
Curated OER
Line of Best Fit
Students explore the concept of linear regression. In this linear regression instructional activity, students do a Barbie bungee activity where they collect linear data. Students plot their data using a scatter plot. Students determine a...
Curated OER
Math and Architectural Design in Relation to Rebuilding The World Trade Center
Students discover building plans and practice reading measurements. In this architectural design lesson, students investigate the areas of the specific World Trade Center locations that need to be rebuilt and determine the cost....
Curated OER
Transformations and Matrices
There are four activities in this extensive lesson covering the identity matrix and scaling, the linear representation of translations, the linear representation of rotations, and reflections. In small groups, they use the Cabri II...
Teach Engineering
Spring Away!
The last segment of the nine-part unit makes a connection between springs and linear equations. Groups hang weights from the spring and measure its length. Then, using the data collected, they calculate the slope to find the k-value of...
Curated OER
Birds' Eggs
More than just data, scatter plots are full of information that can be used to answer a variety of questions. This lesson uses a plot with information about bird egg sizes to answer questions about the relationship between length and...
Curated OER
Tube Viewer Simulation
Students graph linear equations. In this algebra lesson, students discuss the effect the change in one variable has in an equation. They discuss the effect equations have if you chage the value of the variable.
Curated OER
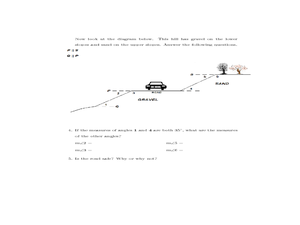
Automobile-Accident Reconstruction
Students investigate an accident and relate it to math. In this trigonometry instructional activity, students measure the accident scene, the friction produced, and the speed from the skid marks. They create a poster of their findings.
Curated OER
The Tipping Point
Students rewrite word problems and solve using math. In this word problem lesson, students gather data and observe the data. They relate this process to the scientific method and math. They review their data to be able to answer...
West Contra Costa Unified School District
Correlation and Line of Best Fit
Computers are useful for more than just surfing the Internet. Pupils first investigate scatter plots and estimate correlation coefficients. Next, they use Microsoft Excel to create scatter plots and determine correlation coefficients and...
Curated OER
Discovering Different Types of Functions
Graph polynomials and identify the end behavior of each polynomial function. The class differentiates between linear, quadratic, and other polynomial equations.
Curated OER
Why Doesn't My New Shirt Fit?
Pupils test Leonardo da Vinci's view of the human body by measuring various body parts using a tape measure. They create a data table and a scatter plot and then analyze and interpret the results using a graphing calculator.
Curated OER
Interpreting and Displaying Sets of Data
Students explore the concept of interpreting data. In this interpreting data lesson, students make a line plot of themselves according to the number of cubes they can hold in their hand. Students create their own data to graph and...


