Curated OER
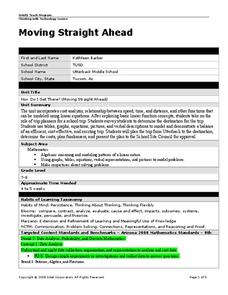
Moving Straight Ahead
Students analyze the relationship between speed, time and distance. In this math lesson plan, students plan a school trip. Students determine the efficiency and cost effectiveness of a trip.
Curated OER
Basic Matrix Algebra
Students perform basic matrices operations. In this algebra lesson, students add, subtract, multiply and divide matrices. They solve system of equations using matrices.
Curated OER
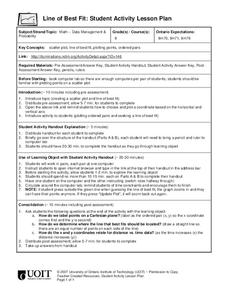
Line of Best Fit
Learners calculate the equation of the line of best fit. In this statistics lesson, students create scatter plots and find the line of best fit going through their data. They make predictions and draw conclusions.
Curated OER
A Statistical Study on the Letters of the Alphabet
Learners use a book or magazine to research the use of letters. They complete a worksheet and compare their results.
Curated OER
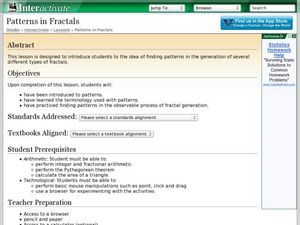
Patterns in Fractals
Learners explore the concept of fractal patterns. For this fractal pattern lesson, students use an applet about the Hilbert Curve to answer questions about rectangles and other polygons. Learners derive the fractal pattern when dividing...
Curated OER
Transformations
Tenth graders recognize, perform and derive rules for basic transformations including translation, reflection and rotation. They also consider compositions, a combination of two or more basic transformations. Students explore both...
Curated OER
Brian's Pegboard II
Learners are able to assess a problem and use systematic methods to solve the problem. They also find out all the possible outcomes for a sequence of events using tree diagrams.
Curated OER
Measures of Spread
Young scholars explore the concept of measures of spread. For this measures of spread lesson, students calculate the standard deviation for a set of data. Young scholars use the standard deviation to analyze and describe the set of...
Curated OER
M&M Exponential Activity
Students create a scatter plot of their experimental data. In this algebra lesson, students use M&M's to determine an algebraic model. They discuss results in class.
Curated OER
Graphing Current Drug Data
Learners increase understanding of the drug issue and further develop skill in graphing.
Curated OER
Using Recipes to Reinforce Fractions
Students, in groups, make a presentation to the class explaining how and what they did to increase the recipe they were given so that they would have the correct amount of ingredients to make their pancakes for the whole class.
Curated OER
Introduction to Descriptive Statistics
Students follow examples to study basic concepts of statistics. They work independently through the activities.
Curated OER
Cartesian Coordinate System
Students research the Cartesian Coordinate System and its many uses in the world of mathematics and algebra.
Curated OER
Statistics and Shopping
Students examine statistics and data analysis concepts from the practical questions that arise in everyday life.
Curated OER
10 Huh?
Young scholars use powers of ten to make reasonable estimations for list of questions. They share their problem solving techniques with the class.
Curated OER
Sorting Lids
Students practice sorting lids in different ways so that each group determines a sorting pattern. They examine how to work in groups while sharing ideas. They establish group work relationships that become apparent to the teacher in this...
Curated OER
Computing Mean, Mode and Median
Ninth graders collect data on basketball player's heights and determine the mean, median, and mode for the data.
Curated OER
Introduction to Scatter Plots and Correlation
Learners examine the concept of scatter plots. They compare baseball statistics to locate the ones that correlate with winning, and identify the positive, negative, and no correlation in sets of data using MS Excel.
Curated OER
Guess My Piece -working with Legos
Students participate in guessing their partners' hidden Lego pieces from their verbal clues. They work in partners to accomplish their goals. They are meeting a variety of math standards by completing this lesson.
Curated OER
GED Math: Internet Support for Varied Solution Methods
Twelfth graders, who teach GED classes, discuss math as an individual problem solving process rather than as a single method of getting the right answer. They visit Websites dealing with math problem solving situations and answer...
Curated OER
How Wealthy Are Europeans?
Students investigate measures of central tendency. They examine compiled data and conduct critical analysis. The graph is focusing on the gross domestic product data. The lesson also reviews the concept of putting values in order of...
Curated OER
Hexagoning the Circle
Students explore similarity to see that the area of a circle should be a constant times the square of its radius. Students create a hexagon. Students share their designs with the class.
Curated OER
Modeling Population Growth
Students investigate the reasons for taking a census and determine the problems that are involved in the process. They examine the population figure for Montana and Lake county before using the information to complete the included...
Curated OER
Math Lesson: How Many People Live There?
Students are able to calculate the population density of a country, and calculate the population density of large cities in that country. They are able to create an appropriate graph to represent their data for that country.
Other popular searches
- Experimental Probability
- Probability Games With Dice
- Probability Games
- Theoretical Probability
- Probability Sample Space
- Math Probability
- Compound Probability
- Probability and Statistics
- Genetics Probability
- Conditional Probability
- Probability Lesson Plans
- Simple Probability


