Curated OER
A Statistical Study of the Letters of the Alphabet
Students gather appropriate information for simple statistical analysis. Then they will calculate probability working with a piece of literature that makes this lesson ideal for teaching across the whole curriculum.
Curated OER
Confidence Intervals: Population Proportions
For this interval worksheet, students examine given data to construct a confidence interval for a specified proportion. They also identify the minimum sample size needed to support the required margin of error around the population....
Curated OER
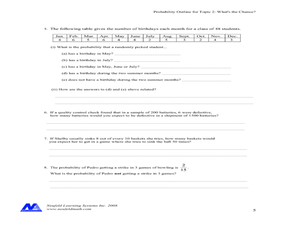
Concept: What's The Chance?
In this concept worksheet, students perform probability experiments. Using collected information, they interpret the data. Students answer questions about probability. This five-page worksheet contains approximately 15 multi-step...
Curated OER
Sorting Polygons
Tenth graders identify and classify polygons according to various attributes. In this sorting polygons lesson, 10th graders describe, classify and comprehend relationships among types of two-dimensional objects using their defining...
Curated OER
What are My Chances?
Learners calculate the chance of an event occurring. In this statistics lesson, students use combination and permutation to calculate the probability of an event occurring. They differentiate between theoretical and experimental...
Bowland
Speed Cameras
Do speed cameras help reduce accidents? Scholars investigate this question using a series of spreadsheet activities. Along the way, they learn about randomness, probability, and statistical analysis.
Curated OER
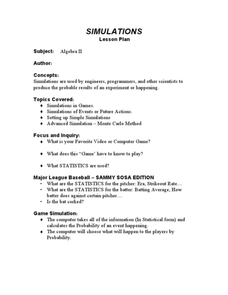
Simulation and Statistics
Students perform simulation of video games as they explore statistics. In this algebra lesson, students relate concepts of statistics and data collection to solve problems. They decide their next step based on the previous assessment of...
Curated OER
Mean and Median
Students identify the different central tendencies. In this probability lesson, students create the correct type of graphs to analyze their data. They make predictions and draw conclusions from their data.
Curated OER
An Introduction to Mathematica and the "Birthday Problem"
Twelfth graders determine the probability of two people in their class sharing the same birthday. In this determining the probability of two people in their class sharing the same birthday problem instructional activity, 12th graders...
Curated OER
The Monty Hall Problem
Learners define and differentiate between experimental and theoretical probability. In this statistic lesson, students play the game "Monty Hall" and use probability to come up with the best strategies to play the game.
Curated OER
Make a Pass at Me
Students identify different types of functions and units of measurements. In this statistics lesson, students will collect data, graph their data and make predictions about their data. They plot a linear regression graph.
Curated OER
Data Collection
Pupils investigate qualitative and quantitative data. In this statistics lesson, students gather data on heights and weights of people and graph the distribution. Pupils discuss the differences between qualitative and quantitative data.
Statistics Education Web
When 95% Accurate Isn’t
Investigate the effect of false positives on probability calculation with an activity that asks scholars to collect simulated data generated by a calculator. To finish, participants analyze the probability of certain outcomes which lead...
Statistics Education Web
The Egg Roulette Game
Hard boiled or raw? Which egg will you get? A hands-on activity has scholars explore the impact of conditional probability. Based on a skit from the Tonight Show, pupils model the selection of the two types of eggs using beads. They...
Bowland
How Risky is Life?
"Life is more risk management, rather than exclusion of risks." -Walter Wriston. Scholars use provided mortality data to determine how likely it is a person will die from a particular cause. They compare the data to the perception of the...
Curated OER
Make That Shot!
Students figure out basic percentages by shooting paper balls into a basket, recording results, and calculating individual and team percentages for ten shots.
Curated OER
Observing M&M Colors: A Multinomial Experiment
Learners use hands-on activities to study statistics. They review the chi-square distribution and expected value. Activities involve discovering calculation a hypothesis, frequency distribution, and probability.
Curated OER
Scatterplots
Students evaluate equations and identify graphs. In this statistics lesson, students identify plotted points on a coordinate plane as having a positive, negative or no correlation. They complete basic surveys, plot their results and...
Curated OER
Data and Scientific Graphs
Learners conduct experiments and graph their data. In this statistics instructional activity, students collect data and graph it on a coordinate plane. They analyze the data looking for patterns and they discuss their findings with the...
Curated OER
Mean Meadian and Mode
Students apply central tendencies to given data. In this statistics lesson, students calculate the mean, median, and mode as it relates to their data. They collect data and graph it while identifying the way the numbers are ordered.
Curated OER
A Data Processing Lesson for Statistics -- Reading a Table or Chart
Students identify the structure and key parts of tables and charts. They determine which data is meanjngful and make comparisons with the data. They describe the scope of the AIDS plague throughout the world.
Curated OER
A Statistical Study on the Letters of the Alphabet
Students see that there are mathematical rules that can affect our use of the English language. Calculate the probability of picking any letter at random from a piece of English literature.
Curated OER
Calculating Theoretical & Experimental Probability
Students explore the concept of experimental and theoretical probability. In this experimental and theoretical probability instructional activity, students collect data by conducting a survey of their classmates. Students compare their...
Curated OER
Statistics and Shopping
Students examine statistics and data analysis concepts from the practical questions that arise in everyday life.


