Curated OER
Stem and Leaf Plots and Circle Graphs
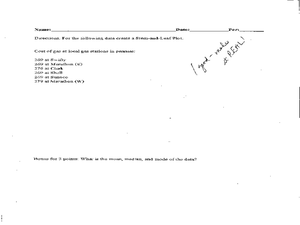
Students graph and plot numbers and analyze their data. In this algebra lesson, students identify the different properties of a stem and leaf plot. They decide which type of graph to use when it comes time to analyze their data.
Flipped Math
Unit 4 Review: One Variable Statistics
It's always nice to slow down and review. Scholars work on problems covering concepts on one-variable statistics. They create and interpret box plots and stem-and-leaf plots, determine the mean, median, mode, interquartile range, and...
Curated OER
Data Handling
In this data handling worksheet, students explore multiple ways to represent data. They create stem and leaf plots, histograms, and bar charts. Students examine and interpret diagrams and statistics. This eleven-page...
Curated OER
Statistics
In this statistics worksheet, 9th graders solve and complete 5 various types of problems related to determining statistics. First, they determine the data set where the median value is equal to the mean value. Then, students determine...
Curated OER
Statistics
In this statistics learning exercise, 9th graders solve and complete 8 different problems that include various measures of central tendency. First, they find the mean, median, and mode for each set of data. Then, students find the median...
Curated OER
Measures of Central Tendency
In this measures of central tendency worksheet, learners find the mean, median, and mode of 9 problems given different data sets. Students then solve 2 word problems.
Curated OER
comparison of Two Gender Sports Teams
Students gather data on sports team and create a box and whisper plot. In this data collection lesson, students find the median, the quartile range, and relationships between variables.
Curated OER
Tech Algebra: A Statistics Study
Students use the internet to gather a minimum of thirty pieces of data. Students create box and whisker graphs, and stem and leaf plots from the information. They calculate mean, median, mode, and range. Students write a summary and...
Curated OER
Stem and Leaf Plots
In this math worksheet, students organize data into stem and leaf plots. They select the correct stem to use to organize the data. Students analyze the data on a given stem and leaf plot.
Curated OER
Data Analysis Self-Test
In this data analysis worksheet, students complete 1 problem that has 7 parts involving mean, median, mode, range, and quartiles. Students then perform 5 operations with matrices.
Curated OER
Measures of Central Tendency
In this measures of central tendency worksheet, students find the mean, mode and range of given sets of data. They interpret box-and-whisker graphs and stem-and-leaf plots. This two-page worksheet contains eleven multi-step problems.
Curated OER
Integration: Statistics
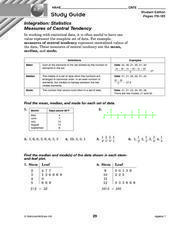
For this math worksheet, students find the mean, median and mode for 6 number sets. Students then find the median and mode for data found in 2 stem-and-leaf plots.
Rice University
Introductory Statistics
Statistically speaking, the content covers several grades. Featuring all of the statistics typically covered in a college-level Statistics course, the expansive content spans from sixth grade on up to high school. Material...
Radford University
Let's Buy a Car
Ready to buy a car? Learners research different makes and models of cars to decide on the best one to buy. They collect data on cost, fuel efficiency, safety ratings, and insurance costs, then create and analyze data displays to make...
CK-12 Foundation
Graphs for Discrete and for Continuous Data: Discrete vs. Continuous Data
Not all data is the same. Using the interactive, pupils compare data represented in two different ways. The learners develop an understanding of the difference between discrete and continuous data and the different ways to represent each...
Radford University
How Do Facebook Likes Accrue Likes?
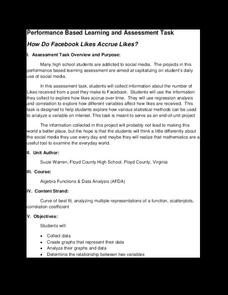
Finally, a project pupils will instantly like! Young mathematicians collect data on the number of likes they receive for a social media post over time. During the first part of the project, they determine a curve of best fit and...
Curated OER
Bringing Statistics Alive
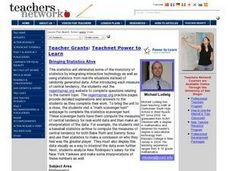
Students compute mean, median and mode and compare mean, median and mode to a real-world application to identify their practical uses. They apply mean, median and mode to real-world statistical data. Finally, students organize data into...
Curated OER
Measures of Central Tendency: Pages 178-183
In this math worksheet, young scholars find the mean, median and mode for 2 stem and leaf tables, 4 number sets. Students also find a set of numbers for given mean, median and mode.
Virginia Department of Education
Middle School Mathematics Vocabulary Word Wall Cards
Having a good working knowledge of math vocabulary is so important for learners as they progress through different levels of mathematical learning. Here is 125 pages worth of wonderfully constructed vocabulary and concept review cards....
Curated OER
In the Wake of Columbus
Students explore how the population decreased in native cultures.
Curated OER
MAP Practice
For this geometry worksheet, students create circle, line and bar graphs using different comparisons of events. There are 24 questions with an answer key.
Willow Tree
Circle Graphs
Pie isn't just for eating! Scholars learn to create pie charts and circle graphs to represent data. Given raw data, learners determine the percent of the whole for each category and then figure out the degree of the circle that percent...
Curated OER
Heartbeat Project
Students enter information about their heartbeats into a spreadsheet. They construct data displays and calculate statistics. They describe and justify their conclusions from the data collected.
Curated OER
BEETLES: The Coming Out
Students design an experiment to test the variables involved in the hatching of the Bruchid beetle.


