Math Mammoth
Stem-and-Leaf Plots 3
For this stem-and-leaf instructional activity, students place statistical data in a stem-and-leaf plot. They identify the median, and range in a given set of data. There are four multi-step problems on this one-page instructional activity.
Math Mammoth
Circles Graphs and Percents
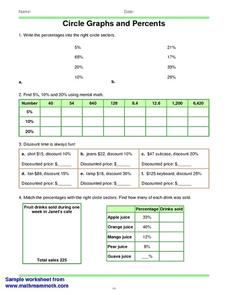
For this percent instructional activity, students read and interpret circle graphs. They determine discounts, and match percentages with circle sectors. This one-page instructional activity contains approximately 30 problems.
Math Mammoth
Bar Graphs 1
In this bar graph activity, students organize data in a frequency table, then create a bar graph. They find the average of the data. This one-page activity contains two multi-step problems.
Curated OER
Box and Whisker Plots
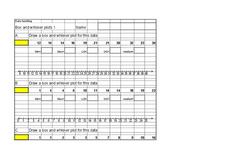
In this math worksheet, students compute the median of sets of numbers. They create box and whisker plots. Students identify the median, upper and lower quartiles, and minimum/maximum amounts. On the last page of this worksheet, students...
Curated OER
Data Analysis and Probability
Students make their own puzzle grid that illustrates the number of sit-ups students in a gym class did in one minute, then they make a histogram for this same data. Then they title their graph and label the scales and axes and graph the...
Curated OER
Statistical Process Control
Students brainstorm items they have that use memory and view Statistical Process Control PowerPoint presentation. They complete Statistical Process Control Simulation/experiment then find the average, range and standard deviation in...
Curated OER
Comparing Data
Eighth graders create a survey, gather data and describe the data using measures of central tendency (mean, median and mode) and spread (range, quartiles, and interquartile range). Students use these measures to interpret, compare and...
Curated OER
How Many Is Too Many?
Students explore the population explosion. They view a video depicting the exponential growth of human population. Students research the internet to project future population data. They perform hands-on, multimedia activities to study...
Curated OER
How Many Stars in the Milky Way?
Students perform an experiment in which they will use a statistical method called `sampling' to count to a billion (and beyond). Students practice sampling by estimating the number of characters on a page from the classified section of a...
Curated OER
What Color Are Your Skittles?
Students create spreadsheets and manipulate data. They collect data, create appropriate graphs and use percentages to describe quantities. Students compare and contrast data. They use spreadsheets to generate a pie chart.
Curated OER
Ideas That Lead to Probability
Students explore and define the concept of probability. They utilize a random number generator to determine the fairness of a game. Internet and printable versions fo the activities are included.
Curated OER
Graphic Accounts
Students identify the use of different types of bar graphs. They analyze graphs used in the New York Times to compare the estimated cost of the war in Iraq to other hypothetical expenditures and reflect on how graphs can help illustrate...
Curated OER
Income Levels & Social Class: Is It All About Cash?
Students graph data and interpret that data after reading information about lifestyles and income levels. They calculate percentages, set up spreadsheets and calculate columnar data.
Curated OER
Oyster Morphs: Adaptations to the Environment
Learners demonstrate how organisms adapt to their environment. They examine prey and predators, natural selection, and adaptations by representing oyster morph.
Curated OER
Asthma Survey
Young scholars collect survey data on the prevalence of asthma in a community. They summarize and display the survey data in ways that show meaning.
Curated OER
Plum Stone Dice Game
Students read about a Native American dice game online. They make replica games, and practice playing with them. They predict the outcome of the dice rolls by completing a dice throw chart.
Curated OER
A Statistical Study of the Alphabet
Students determine probability by completing statistical study on letters of the alphabet and comparing and contrasting results.
Curated OER
Make That Shot!
Students figure out basic percentages by shooting paper balls into a basket, recording results, and calculating individual and team percentages for ten shots.
Curated OER
First Class First? Using Data to Explore the Tragedy of the Titanic
High schoolers analyze and interpret data related to the crew and passengers of the Titanic. They research information on a Titanic database to illustrate specific statistical conclusions, and whether or not social status affected the...
Curated OER
Measured Opinions
Students read "Public Is Wary but Supportive on Rights Curbs," at the New York Times online. They explore how opinion polls are created and conducted, focusing on the wording of questions and the methods of sampling a population.
Curated OER
Nazi Concentration Camps -- Map and Chart-Reading Activities
Students use an informational chart about Nazi concentration and death camps to complete a mapping activity and a chart-reading activity.
Curated OER
A Statistical Study of Three Biomes
Students collect data from one of three selected biomes. Data are then organized and statistically analyzed. This project engages students of different backgrounds grouped cooperatively in a relevant outdoor hands-on learning experience.
Curated OER
Teenage pregnancy trends in Canada
Students analyze demographic data relating to teen pregnancy trends. They develop skills to locate and interpret data. They discuss the factors that influence teenage pregancy such as social, economic, and educational issues.
Curated OER
Frequency Tables and Stem-and-Leaf Plots
Students are introduced to the function of frequency tables and stem and leaf plots. In groups, they determine the frequency of their teacher coughing, ringing a bell or raising their hand. To end the activity, they determine frequency...


